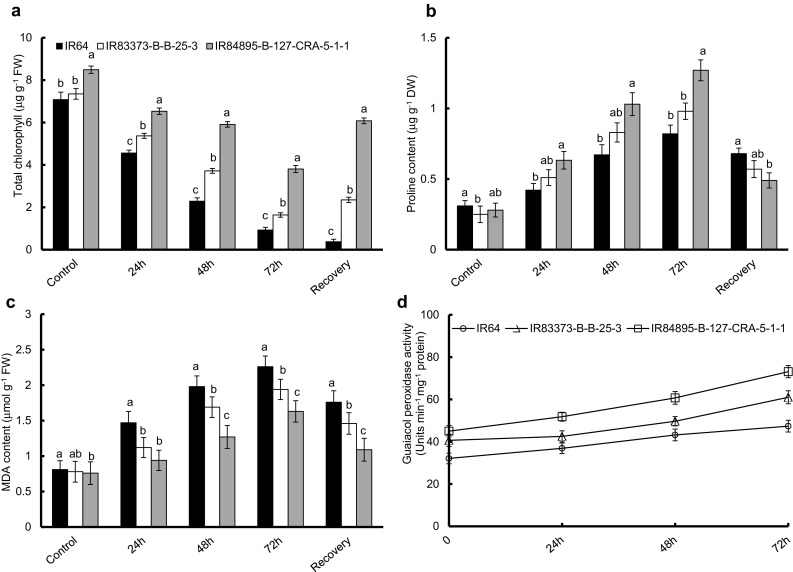
Fig. 4.

Assessment of salt tolerance in selected rice genotypes based on biochemical studies. a Chlorophyll content, b MDA content, c Proline content, d POX activity. Error bars represent mean standard deviation (n = 3). Different letters above the error bars indicate significantly different values (ANOVA, P ≤ 0.05)
