Figure 8.

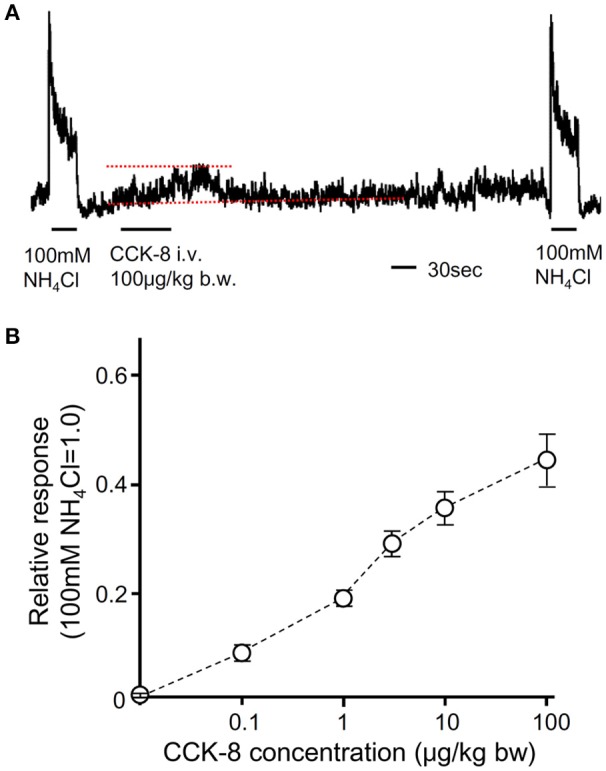
The effect of i.v. injection of CCK-8 on CT nerve activities. (A) A representative recording of CT nerve responses to 100 mM NH4Cl and i.v. injection of CCK-8. Dotted lines indicate baseline (lower) and peak amplitude (upper) of CT nerve activities after i.v. injection of CCK-8. 100 μg/Kg b.w. of CCK-8 was injected from femoral vein. (B) Concentration dependent CT nerve activities in response to i.v. injection of CCK-8 (0.1–100 μg/Kg b.w., n = 5). Values indicated are mean ± SEM.
