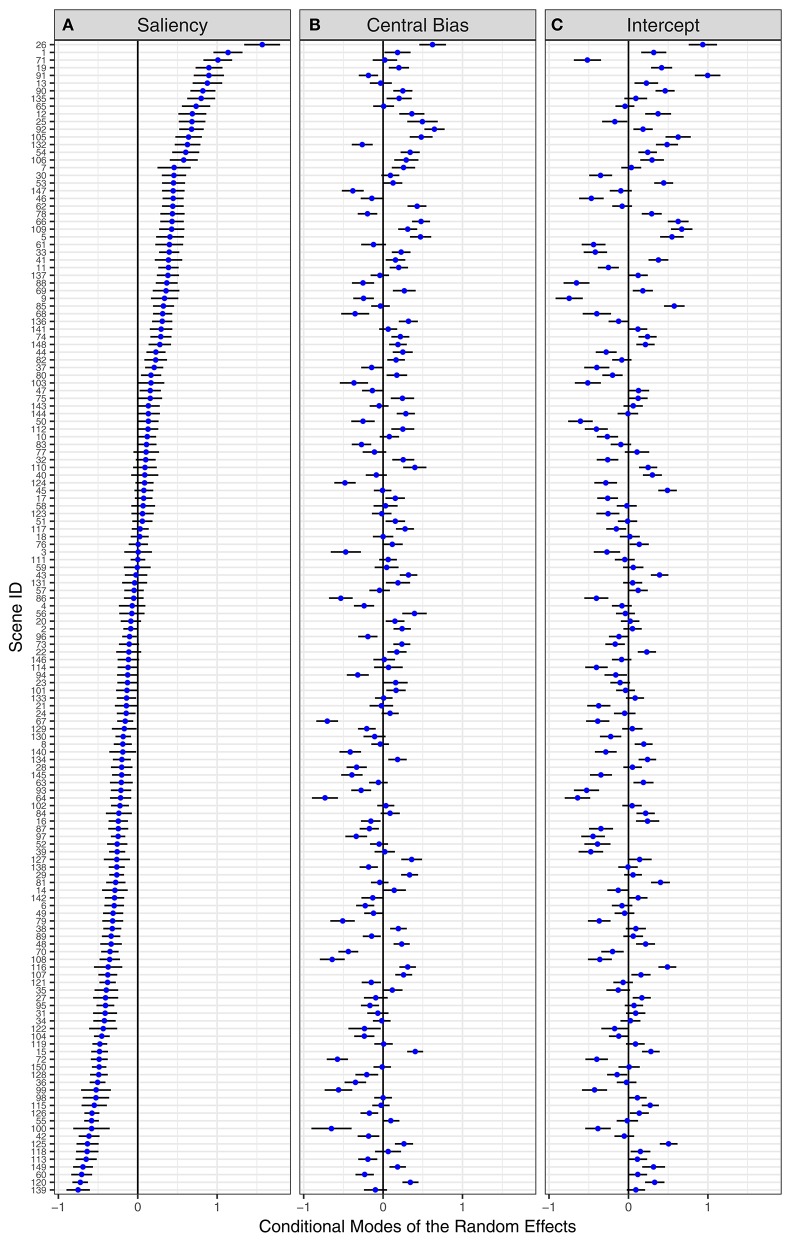
Figure 7.
By-item random effects for the Central-Bias—Saliency GLMM testing Adaptive Whitening Saliency. “Caterpillar plots” for conditional modes and 95% prediction intervals of 150 scene items for (A) saliency effect, (B) central-bias effect, and (C) mean fixation probability. Scene items are ordered by the saliency effect. The numbers on the y-axis are the scene IDs.

