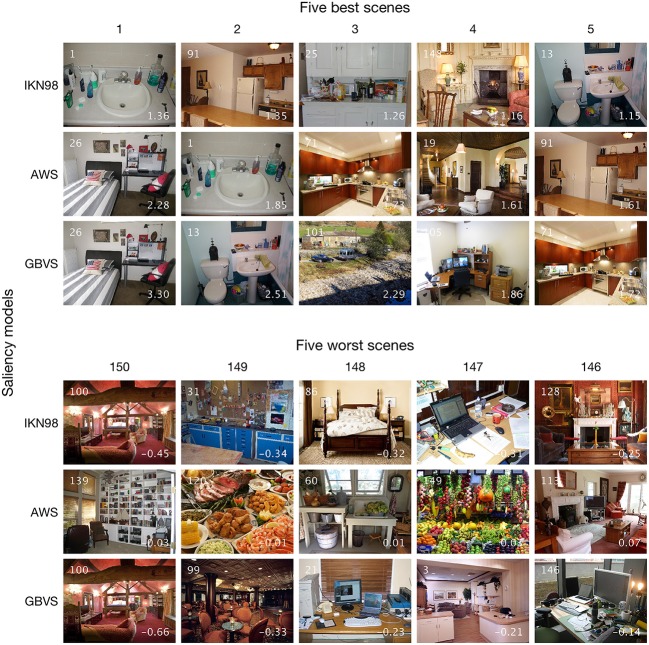
Figure 8.
Five best and five worst scenes based on by-item random slopes for image salience. The ranking (1–5 and 150–146) is based on the results from the three Central-Bias—Saliency GLMMs (Table 3). Rows contrast the three tested saliency models. The three top rows show the five best scenes for a given saliency model; the five worst scenes are depicted in the bottom half of the figure. For a given thumbnail image, the white inset number at the top left is the scene ID. The numbers at the bottom right are the individual item coefficients, which are obtained as the sum of fixed-effect estimates and predictions for random effects. Note that there are common scenes for which the tested saliency models perform particularly well.

