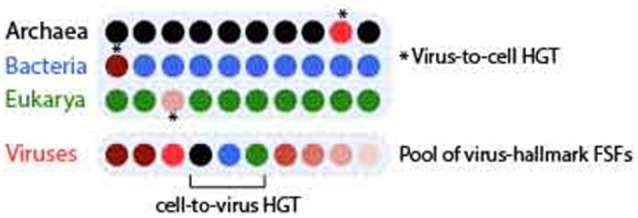
Figure 1.

Demonstration of virus-to-cell and cell-to-virus HGT events. Ten genomes are displayed as colored closed disks each for Archaea (black), Bacteria (blue), Eukarya (green), and viruses. Seven out of 10 viral genomes encode different virus hallmark FSFs (with incidence represented by different shades of red) such as those involved in virion synthesis and capsid assembly. If any of these virus-hallmark FSFs is detected in no more than 1/10 cellular genomes (real f-values are even lower), the event is determined to be virus-to-cell HGT. In turn, any of the cellular FSFs that are widespread in cells (i.e., present in 9/10 cellular genomes) are detected in a viral genome, that event is determined to be cell-to-virus HGT.
