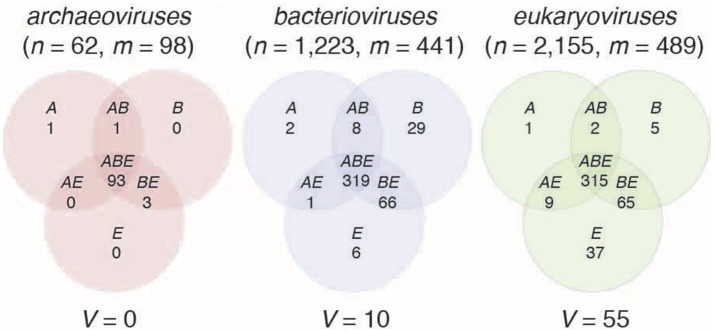
Figure 2.
Sharing of protein structural domains between viral and cellular proteomes. The Venn diagrams illustrate the number of FSFs detected in the proteomes of archaeoviruses, bacterioviruses, and eukaryoviruses and their distributions in the proteomes of superkingdoms Archaea (A), Bacteria (B), and Eukarya (E). n = total number of viral proteomes, m = total number of FSFs detected in viral proteomes. V represents virus-specific FSFs (Table 2).

