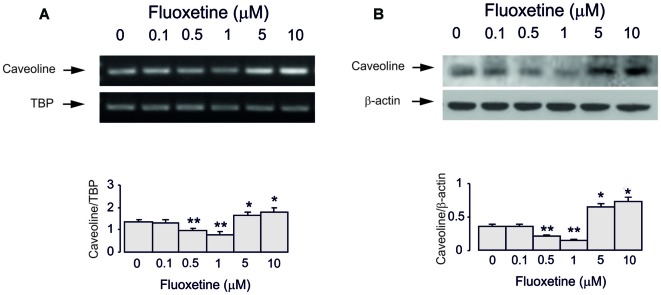
Figure 3.
Regulation of mRNA and protein expression of Cav-1 by chronic treatment with fluoxetine in astrocytes. Cells were incubated for 2 weeks in the absence of any drug (0 μM fluoxetine, control) or in the presence of 0.1, 0.5, 1, 5, or 10 μM fluoxetine. (A) Southern blot from representative experiment. Similar results were obtained from three independent experiments. Average mRNA expression was quantified as ratio between Cav-1 and TBP, used as a house-keeping gene. (B) Immunoblot from a representative experiment. Similar results were obtained from three independent experiments. Average protein expression was quantitated as ratio between Cav-1 and β-actin, used as a house-keeping gene. SEM values are indicated by vertical bars. *Indicates statistically significant (P < 0.05) difference from 0, 0.1, 0.5 and 1 μM fluoxetine; **indicates statistically significant (P < 0.05) difference from all other groups but not from each other.

