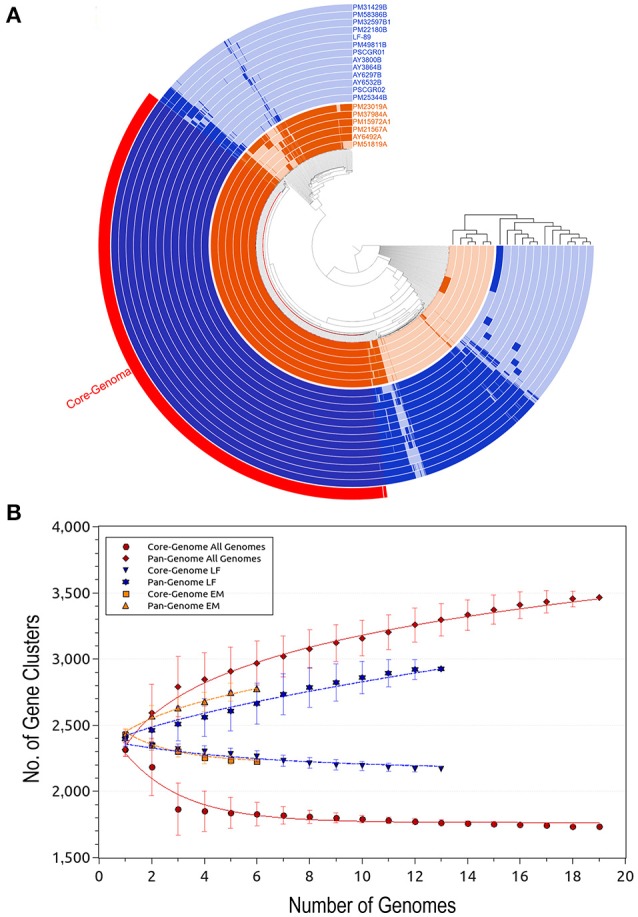
Figure 2.

Predicted size of the Piscirickettsia salmonis pan-genome. (A) Comparative overview of P. salmonis pan- and core-genomes obtained through the Anvi'o tool (Eren et al., 2015). The P. salmonis core-genome is shown in red (1,732 proteins), while the different genogroups are indicated using blue (LF genogroup) and orange (EM genogroup). Each track indicates a genome, color variations (dark/light) indicate presence/absence of genes per genome. (B) Accumulation plots for the full P. salmonis pan- (red diamond) and core-genomes (red circle), as well as for the LF genogroup (blue inverted triangle [pan-genome] and star [core-genome]) and EM genogroup (orange squares [pan-genome] and triangles [core-genome]). Each plot point represents the mean value for any possible combination of gene clusters in the respective number of genomes (i.e. P. salmonis overall, 19 strains; LF genogroup, 13 strains; and EM genogroup, 6 strains). The curves represent a power law fitting of the data.
