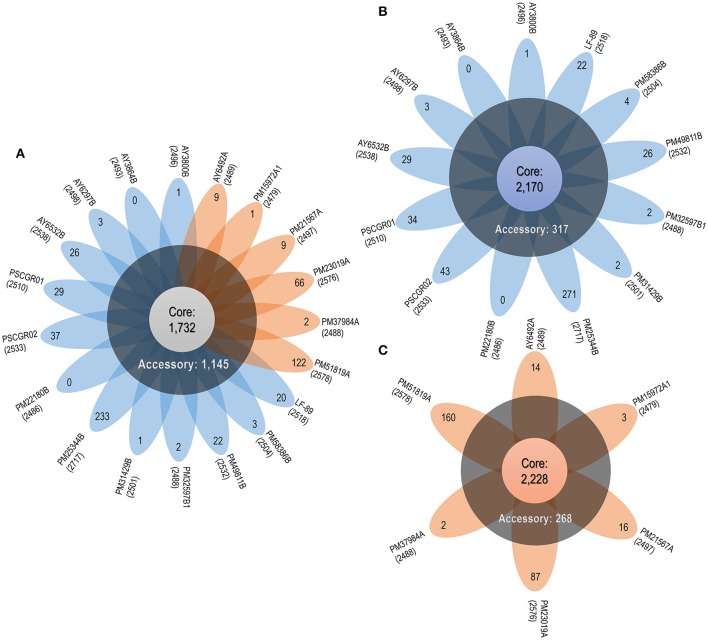
Figure 3.
P. salmonis pan-genome. (A) Flower plot of all 19 P. salmonis strains showing the core-genome size (flower center), number of accessory genomes (around the flower center), and unique genes for each strain (flower petals). (B) Flower plot of the LF genogroup, showing the same information as in (A). (C) Flower plot of the EM genogroup, showing the same information as in (A). Numbers placed in parentheses below the name of each strain indicate the total proteins.

