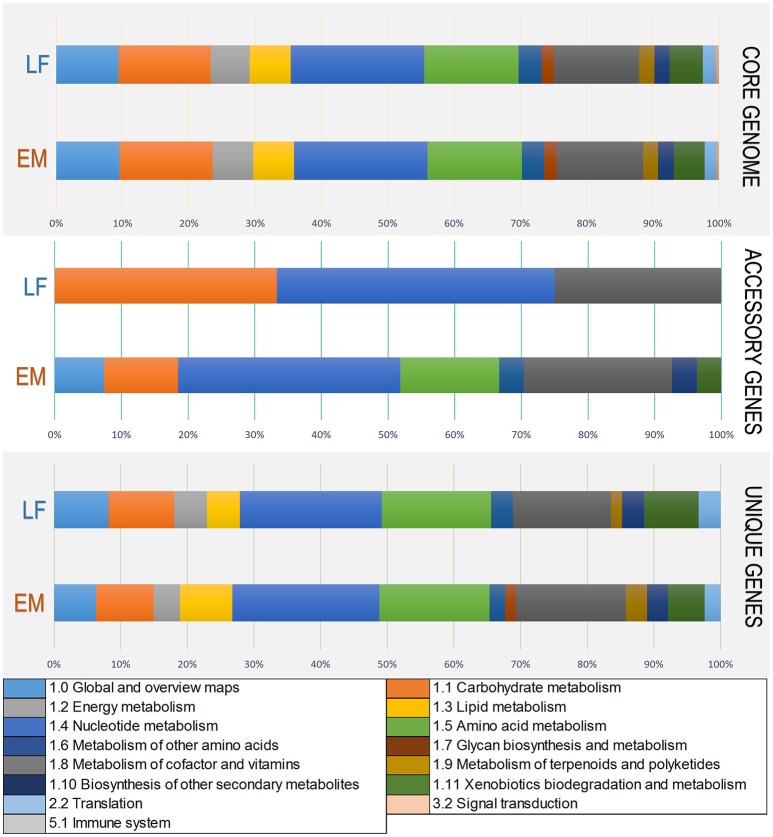
Figure 5.
Variations in KEGG functional annotations of the P. salmonis pan-genome. Shown are variations between the two genogroups in KEGG categories. Variations were visualized using the annotation file (see Materials and Methods) and the KEGG annotation tool in Blast2GO (Conesa et al., 2005). The input data set were separated into the core-genome, accessory genome, and unique genes. Each bar represents a genogroup, and colors inside each bar represent a KEGG category for the genes contained in each section.

