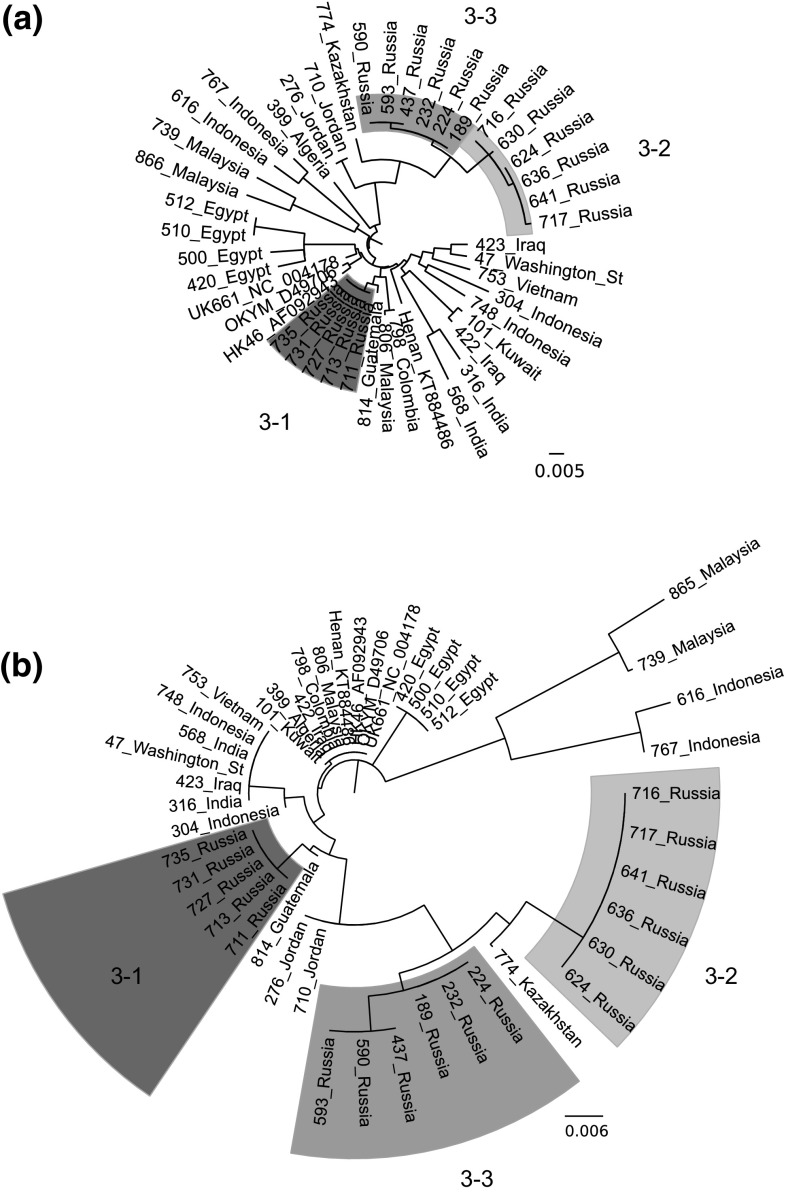
Fig. 2.
Phylogenetic trees of the hvVP2 of genogroup 3 samples. Reference strains are identified by name and GenBank accession number. The evolutionary history was inferred using the neighbor-joining method with 1000 bootstrap replicates. (a) Nucleotide sequences. The tree is drawn to scale, with branch lengths in the same units as those of the evolutionary distances used to infer the phylogenetic tree. The evolutionary distances were computed using the maximum composite likelihood method and are in the units of the number of base substitutions per site. The analysis involved 45 nucleotide sequences. All positions containing gaps and missing data were eliminated. There were a total of 543 positions in the final dataset. (b) Deduced amino acid sequences. The optimal tree with the sum of branch length = 0.15134382 is shown. The tree is drawn to scale, with branch lengths in the same units as those of the evolutionary distances used to infer the phylogenetic tree. The evolutionary distances were computed using the Poisson correction method and are in the units of the number of amino acid substitutions per site. The analysis involved 45 amino acid sequences. All positions containing gaps and missing data were eliminated. There were a total of 181 positions in the final dataset

