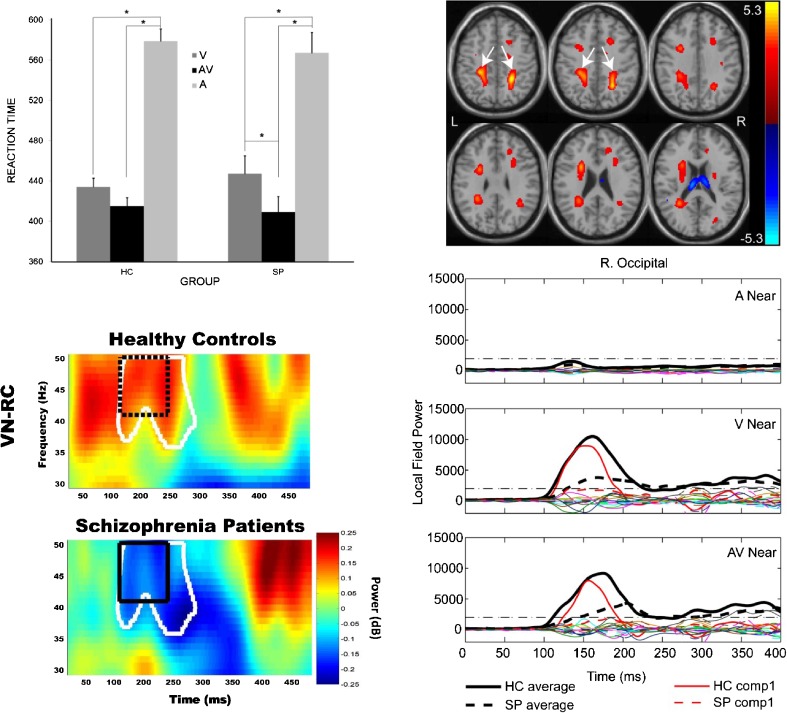
Fig. 3.
Upper left panel: Reaction times (RTs) to auditory, visual and AV stimuli in SP relative to HC from Stone et al. (2014). Lower left panel: Example of differences in gamma band power in SP vs. HC time-frequency maps. Frequency is represented on the y axis while time in ms is represented on the x axis. In this example gamma band power was greater in HC relative to SP (see black box). Upper right panel: Joint ICA component of fractional anisotropy (FA) consistent with the superior longitudinal fasciculus showed larger FA in HC vs. SP. Similarly, the MEG signal over occipital cortex was significantly greater in HC (red solid line) vs. SP (red dashed line). The joint component weighting factor positively predicted performance on the MATRICS cognitive battery suggesting that visual processing and structures that link visual cortex to frontal regions are important for cognitive performance

