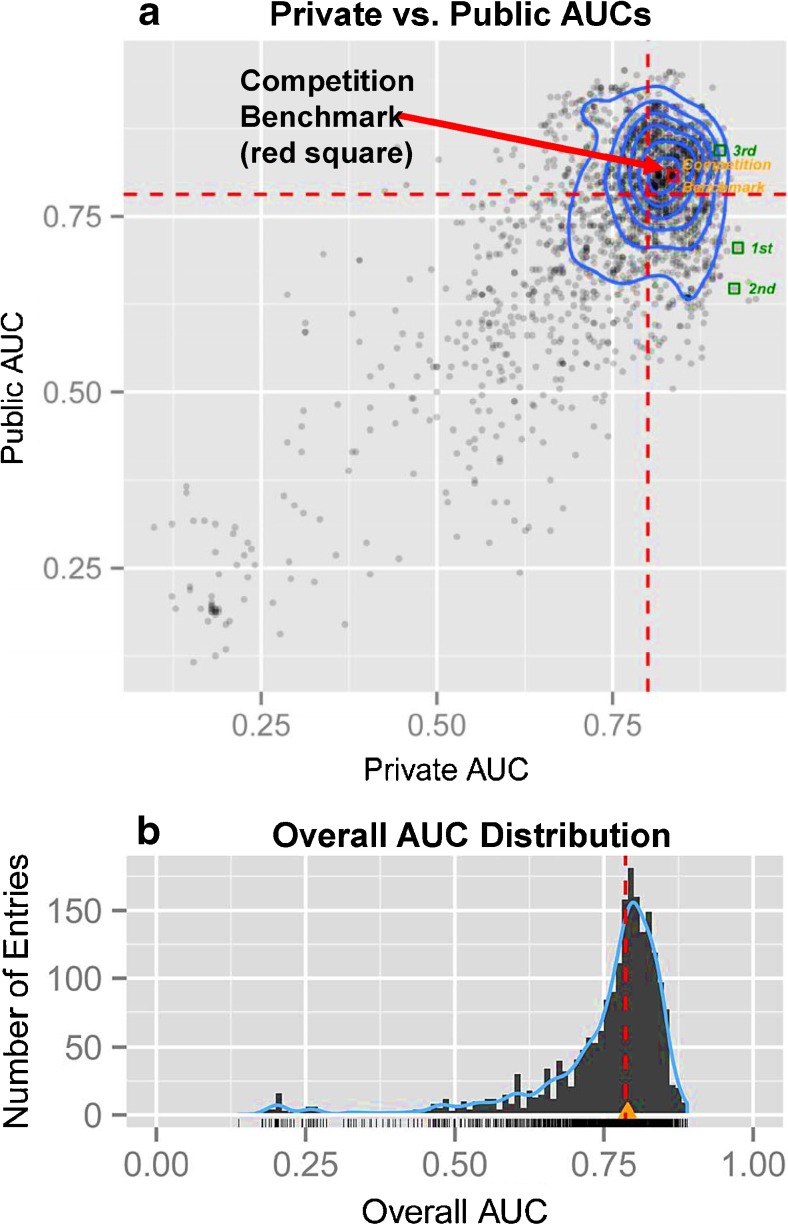
Fig. 7.
a. Dashed red lines represent median values of Public and Private AUCs. Blue contours indicate the centration of entries. The 3 winning entries are shown as green squares at the upper right. 1st and 2nd place entries attained lower public AUCs because the official ranking optimized for extremes along the x-axis only. b. Overall AUC of all 2087 entries. Dashed red line indicates the median. Orange/yellow triangle indicates the competition benchmark (just above the median). No entry was able to attain an overall AUC of 0.9 or higher. Adapted from Silva et al. 2014

