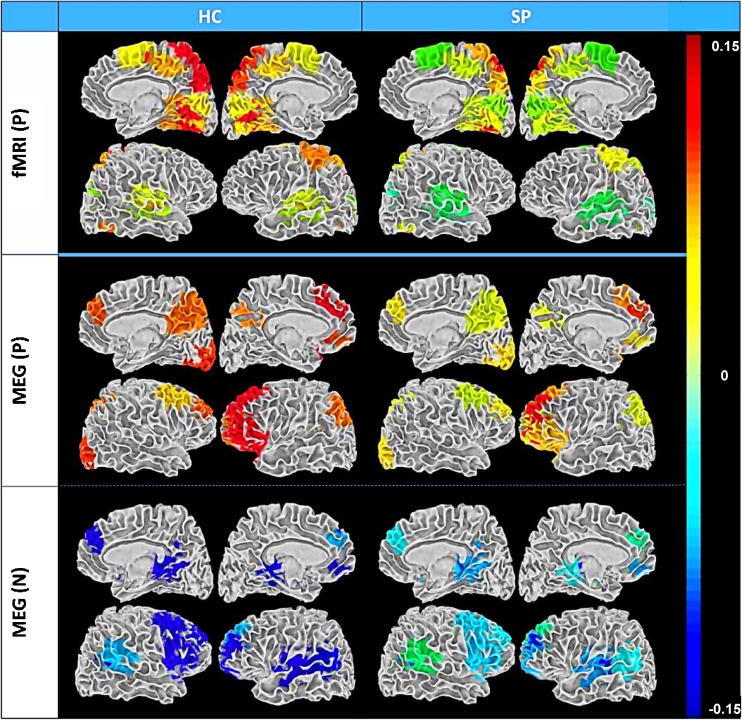
Fig. 8.
Summary of FNC group averages (SP and HC) for fMRI and MEG rendered on white matter surface. P = HC > SP and N = SP > HC. FNC is a measure of among- network connectivity; that is, pairwise correlations in network (ICA component) timecourses. Only those regions involved in significant group differences are included. Color bar values are the mean correlations for each component and group. Importantly, the MEG and fMRI results were quite different from one another (i.e., greater FNC was observed in HC visual networks for fMRI components while greater FNC was evident in SP frontal networks for MEG components (blue color), highlighting the complementary information embedded within these two modalities. We adjusted for multiple comparisons within each network matrix using the false discovery rate correction. Adapted from Houck et al. 2017

