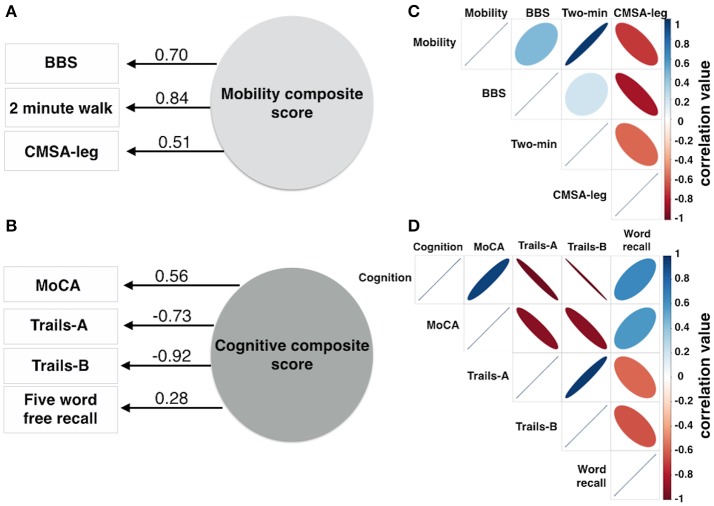
Figure 2.
Composite scores for mobility and cognition were derived from 3 or 4 variables, respectively. Factor analysis produced one factor for mobility (A) and one factor for cognition (B). The numbers adjacent to the lines in (A,B) denote the factor loadings onto the composite score. The correlation matrix describes the individual correlation for the mobility data (C) and cognitive data (D). The color bars in (C,D) represent correlation coefficient values ranging from −1 to 1. The size of the ellipse indicates the degree of shared variance between each of the variables (wide ellipse, low correlation; narrow ellipse, high correlation). BBS, Berg Balance Scale; CMSA-leg, Chedoke-McMaster Stroke Assessment leg score.

