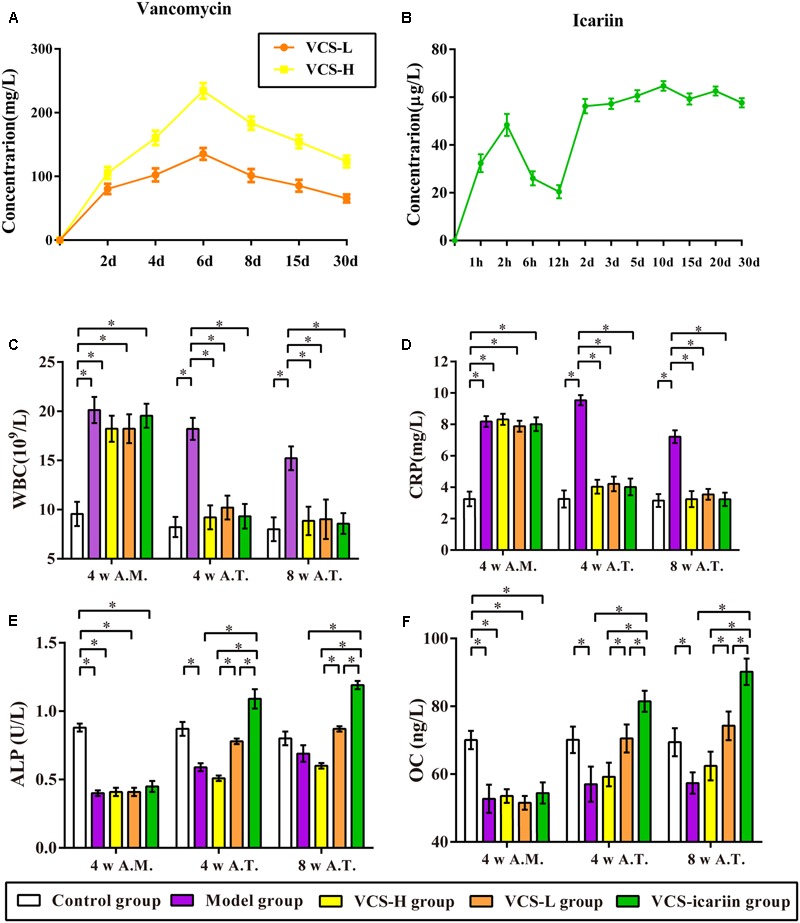
FIGURE 1.

(A) Local concentration-time curves of vancomycin. (B) Serum concentration–time curve of icariin. (C–F) The results of CRP, WBC, ALP, and osteocalcin in the rabbit serum at the fourth week after infection and the fourth week and eighth week after treatment, ∗P < 0.05. 4 w A.M., 4 weeks after the model was established; 4 w A.T., 4 weeks after treatment; 8 w A.T., 8 weeks after treatment.
