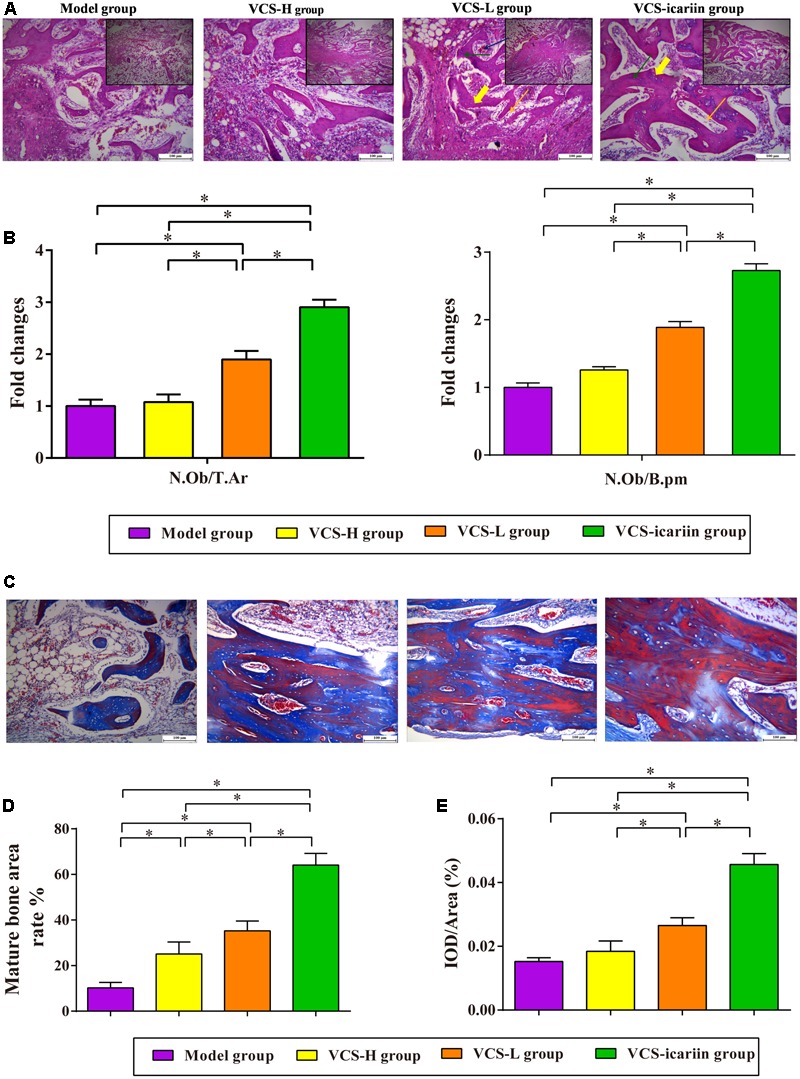
FIGURE 4.

(A) Typical histopathology of the rabbit tibia. Yellow bold arrow: bone trabeculae; orange arrow: osteoblasts; green arrow: osteocytes; blue arrow: vessels. (B) The columns represent the mean ± SE from five rabbits per group, ∗P < 0.05. N.Ob: osteoblast number, T.Ar: trabecular bone area, B.pm: bone perimeter. (C) Masson’s trichrome staining of the tibia at 8 weeks after treatment with VCS-L, VCS-H, and VCS-icariin. (D) The columns represent the mean ± SE of the rate of new bone formation from the analysis of Masson’s trichrome staining. (E) Immunohistochemical staining for OC at 8 weeks after treatment with VCS-L, VCS-H, and VCS-icariin. The columns represent the mean ± SD from six rabbits per group, ∗P < 0.05.
