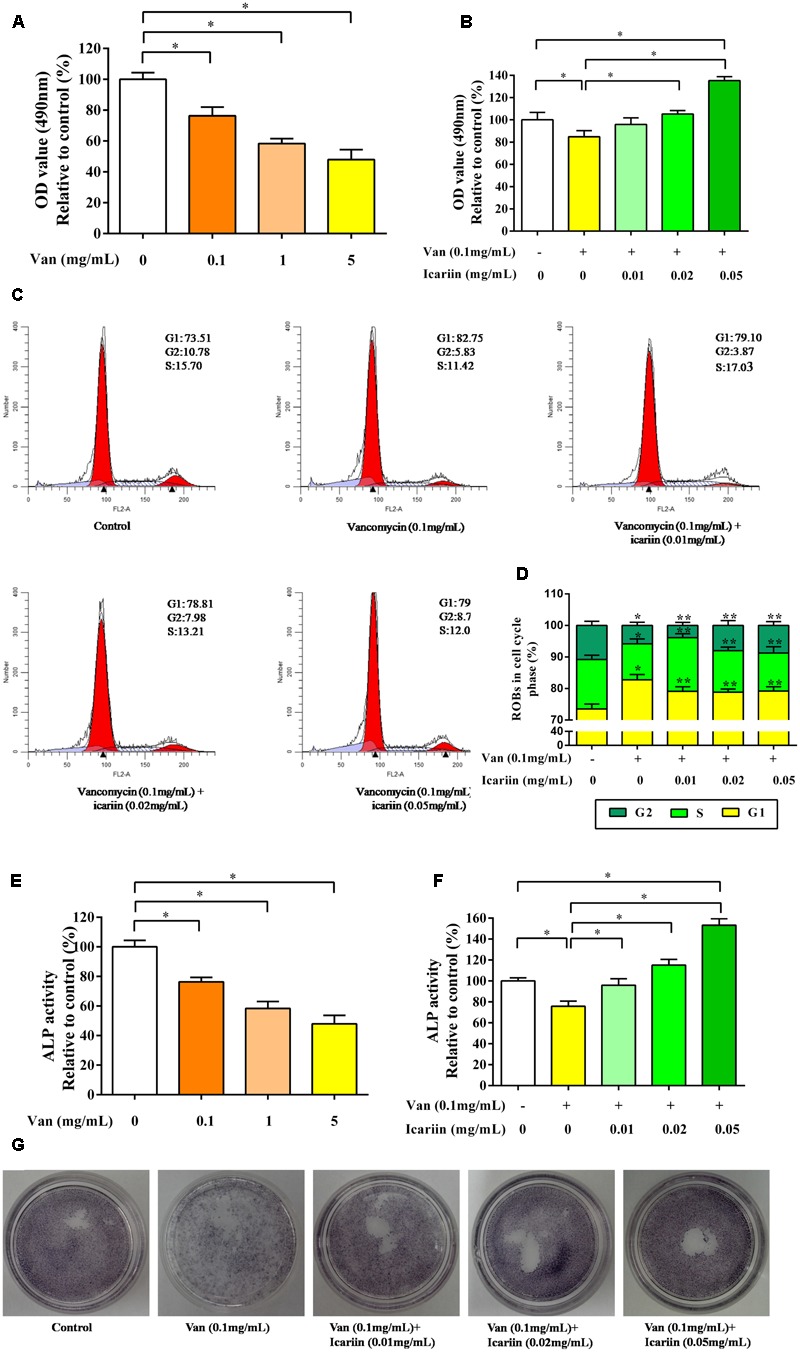
FIGURE 5.

(A) The proliferation capability of ROBs treated with vancomycin, ∗P < 0.05. (B) ROBs treated with vancomycin and icariin, ∗P < 0.05. (C) Cell cycle analysis was performed by flow cytometry using propidium iodide DNA staining of ROBs. (D) The percentages of ROBs in the cell cycle phases were shown in the percentage histogram. Each value represented mean ± SD of three independent experiments. ∗P < 0.05, compared to the control ROBs, ∗∗P < 0.05 compared to ROBs treated with vancomycin. (E) ALP level of ROBs treated with vancomycin, ∗P < 0.05. (F) ALP level of ROBs treated with vancomycin and icariin, ∗P < 0.05. (G) ALP positive staining of ROBs treated with vancomycin and icariin.
