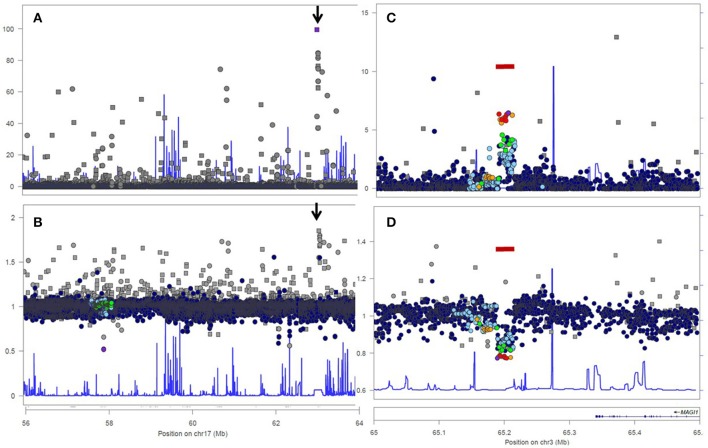
Figure 1.
Analysis of genotyped short variations in genomic region 17:56,000,000–64,000,000 (A,B) and genomic region 3:65,000,000–65,500,000 (C,D) from the 1000 Genomes Project, European Population. Upper figures (A,C) show log-transformed p-values for departures from HWE. Lower figures (B,D) show ratios of observed and expected (i.e., under Hardy-Weinberg Equilibrium) frequencies of heterozygous genotypes. Dots indicate true SNPs, rectangles symbolize variants of indel type. The bar (seen in C,D) indicates common deletion variant esv2657253, (http://www.ensembl.org/Homo_sapiens/StructuralVariation/Explore?r=3:65202694--65229573;sv,esv2657253;svf,3513219;vdb,variation). The arrow (seen in A,B) points to a region with of a degenerate repeat structure within the 5' end of the LRRC37A2 with strong homology with sequences of the LRRC37A3 gene, resulting in genotyping error.

