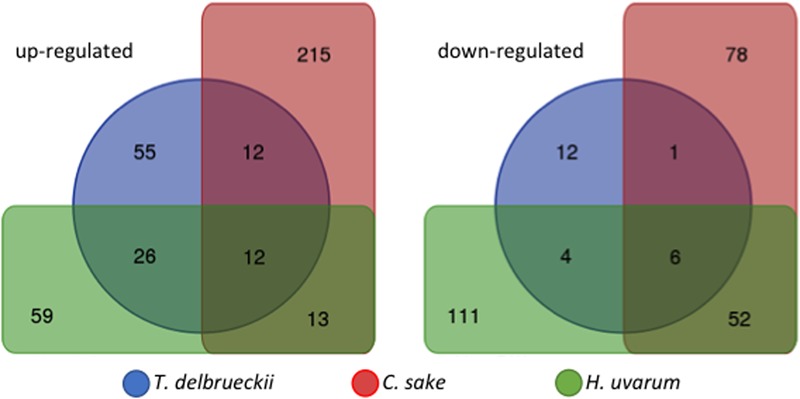
FIGURE 2.

Venn diagram showing up-regulated and down-regulated significant genes (LogFC ≥ 0.5 or ≤-0.5; p-adjusted ≤ 0.05) of S. cerevisiae in response to co-cultivation with different yeasts species.

Venn diagram showing up-regulated and down-regulated significant genes (LogFC ≥ 0.5 or ≤-0.5; p-adjusted ≤ 0.05) of S. cerevisiae in response to co-cultivation with different yeasts species.