FIGURE 6.
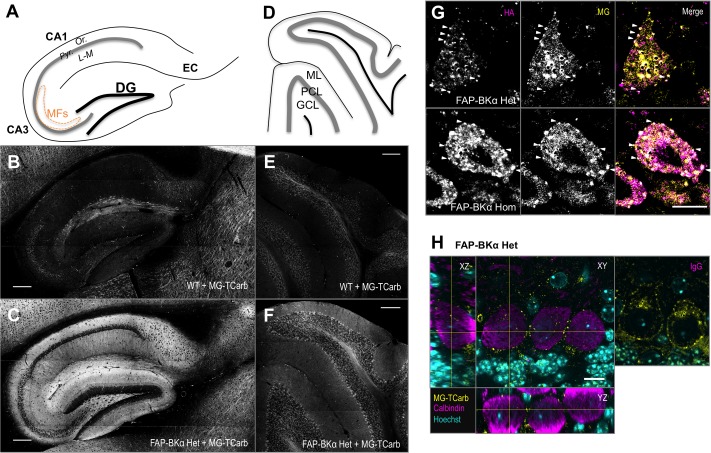
Sagittal sections labeled with MG-TCarb show expected FAP signal in hippocampus and cerebellum. Punctate distribution seen in PCs. (A) Schematic of sagittal hippocampal sections depicting the regions of dentate gyrus (DG), CA3, CA1, and entorhinal cortex (EC). CA layers depicted are stratum pyramidale (Pyr.), stratum oriens (Or.), and stratum lacunosum-moleculare (L-M). Mossy fibers (MFs) in CA3 are depicted by the orange dashed line. (B,C) Images of WT (B) and FAP-BKα Het (C) hippocampi showing FAP-BKα dependent fluorogen activation. Scale bars 200 μm. (D) Schematic of sagittal cerebellar sections depicting the three main layers: granule cell layer (GCL), Purkinje cell layer (PCL), and molecular layer (ML). (E,F) Images of WT (E) and FAP-BKα Het (F) cerebella showing FAP-BKα-dependent fluorogen activation. Scale bars 200 μm. (G) Single optical sections of PCs stained with HA antibody (magenta) and labeled with MG-TCarb (yellow) show colocalization to puncta at the cell periphery, with diffuse signal within the cytoplasmic region in FAP-BKα expressing brains. (H) Staining of PC volumes with calbindin (magenta) shows FAP (yellow) puncta are localized to the cell edge in three dimensions. Hoechst 33342 staining (cyan) shows orientation of PC layer with abundant signal in GCL layer below. No calbindin signal is observed in IgG controls. Scale bars 10 μm.

