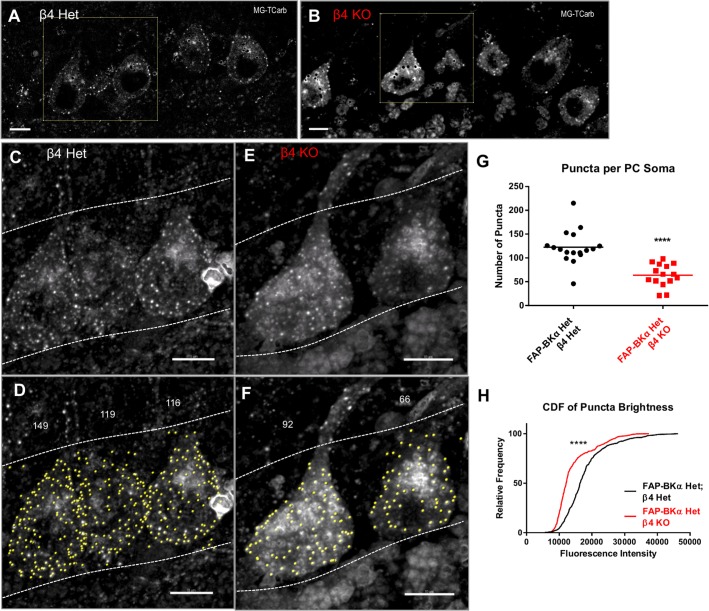
FIGURE 7.
β4 knockout reduces the number of PM FAP-BKα puncta in Purkinje neurons in FAP-BKα Het mice. (A) FAP-BKα Het; β4 Het brains show PM puncta in single optical sections. Black spots result from lipofuscin masking operations. The yellow square indicates cells in (C,D). (B) β4KO brains show DPM puncta in single optical sections. The yellow square indicates cells in (E,F). (C) Z-projection of three PC somata showing bright FAP puncta. Dashed lines indicate borders of PCL with GCL below and ML above. (D) Identification of spots (yellow) by Imaris yields punctum counts per cell. Stray spots not clearly assigned to a soma were excluded from analysis. Counts for the given PCs are shown above. Dashed white lines show area of analysis, demarcating the PCL boundaries. (E) Z-projection of β4KO brains show puncta similar to β4 Het. (F) Analysis of β4KO PCs performed analogously to (D). (G) Puncta counts per cell for β4 Het and β4KO brains. ∗∗∗∗P ≤ 10-4, unpaired t-test with Welch’s correction. (H) Cumulative distribution function for all counted puncta by genotype. ∗∗∗∗P ≤ 10-4, Mann–Whitney rank sum test.

