
FIGURE 2.
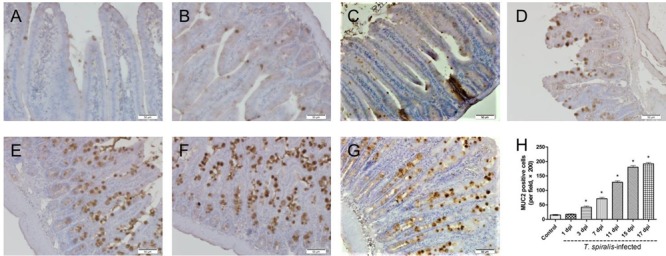
Immunohistochemistry of goblet cells. (A–G) Representative microphotographs showing MUC2-immunopositive cells (corresponding to goblet cells) in the small intestine of control (A) and previously infected mice at 1 dpi (B), 3 dpi (C), 7 dpi (D), 11 dpi (E), 15 dpi (F), and 17 dpi (G); scale bar: 50 μm. (H) Quantification of goblet cells (number per field, ×200). Data show mean ± SEM of three animals per group. ∗p < 0.05 vs. control group.