
FIGURE 4.
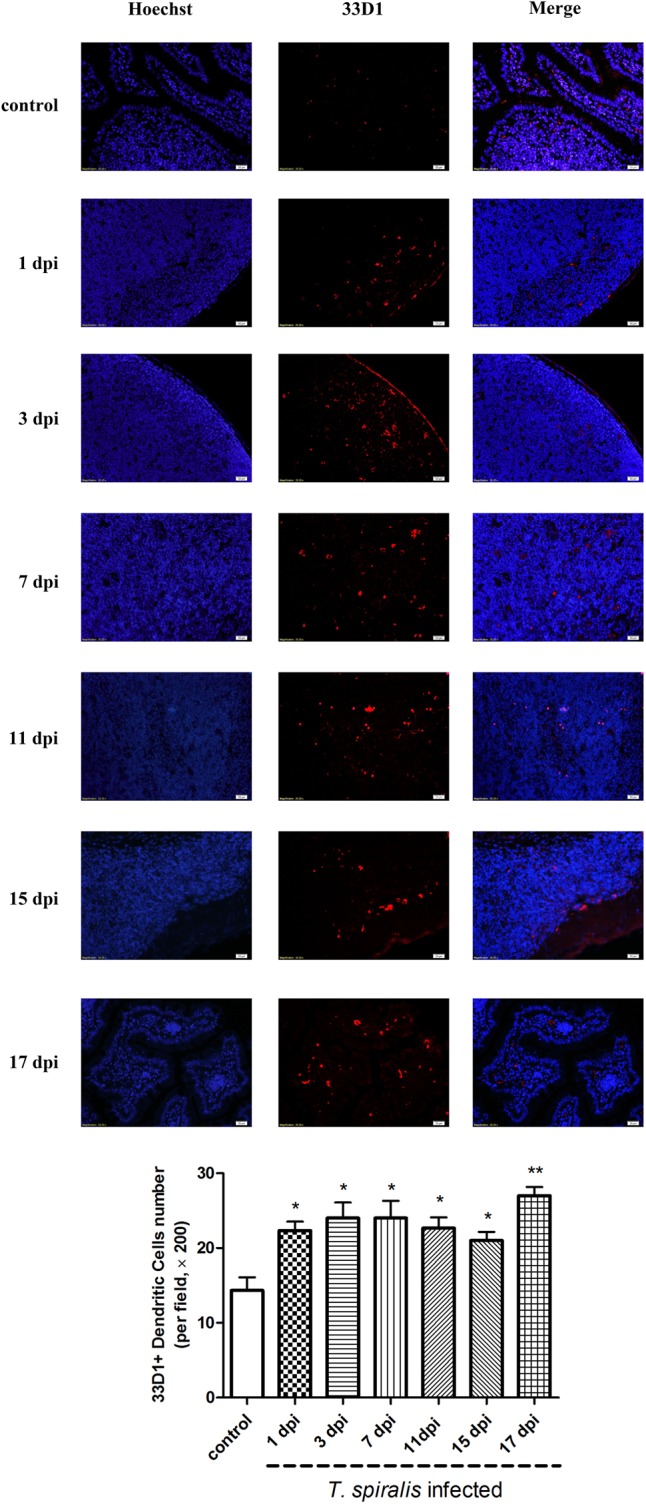
Immunofluorescence of dendritic cells (DCs). Representative confocal microphotographs showing 33D1-immunopositive cells (corresponding to DCs, red-stained cells) in the Peyer’s Patch of control and previously infected mice at 1, 3, 7, 11, 15, and 17 dpi; scale bar: 20 μm. And quantification of 33D1+ DCs (number per field, ×200). Data show mean ± SEM of three animals per group. ∗p < 0.05 vs. control group.