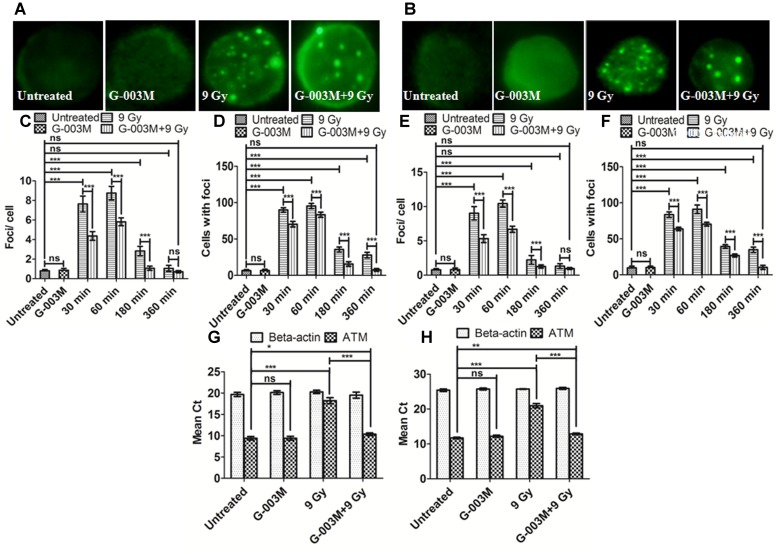
FIGURE 5.
Measurement of ATM kinase in mice blood and bone marrow populations taken at various times after irradiation: (A,B) Representative images of ATM kinase foci in blood and bone marrow respectively. (C) Quantification of ATM kinase foci per cell and (D) ATM kinase foci distribution in blood cells. (E) The graph shows mean ATM kinase foci per cell and (F) the ATM kinase foci distribution in bone marrow cells. (G) The graph represents a quantitative real time PCR bases estimation of β-actin and ATM gene respectively in blood cells processed 1 h after irradiation. (H) The graph represents a quantitative real time PCR bases estimation of β-actin and ATM gene respectively in bone marrow cells processed 1 h after irradiation. n = 6 per group.

