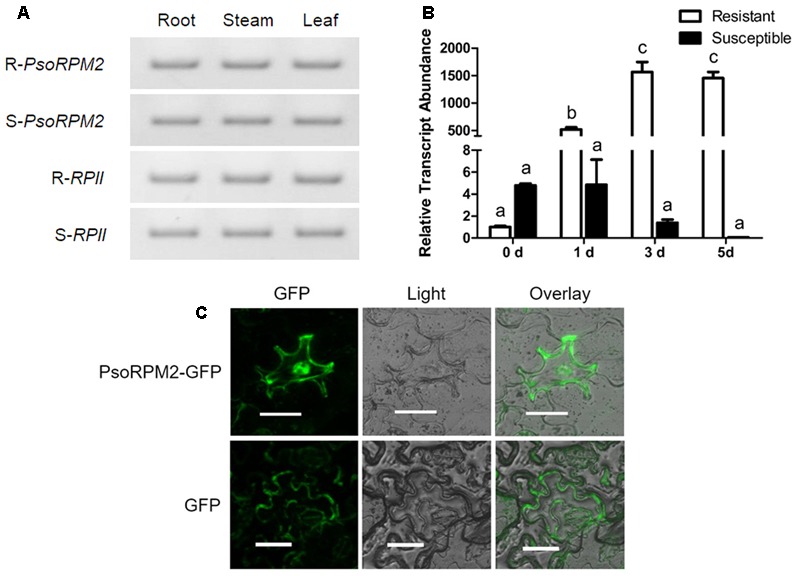
FIGURE 2.

PsoRPM2 expression profile and subcellular localization of PsoRPM2 protein. (A) PsoRPM2 expression in various tissues of resistant (upper two panels) and susceptible (under two panels) P. sogdiana plants. RPII was used as a reference gene. (B) PsoRPM2 expression in root tips following M. incognita infection measured using qRT-PCR. The results show the means ± SD based on three biologic repetitions, each with three technical repetitions. Different letters denote a significant difference at p < 0.05 (Tukey’s test). (C) Protein localization analysis showing PsoRPM2-GFP in the cytoplasm and nucleus of N. benthamiana epidermal cells. Bar = 40 μm.
