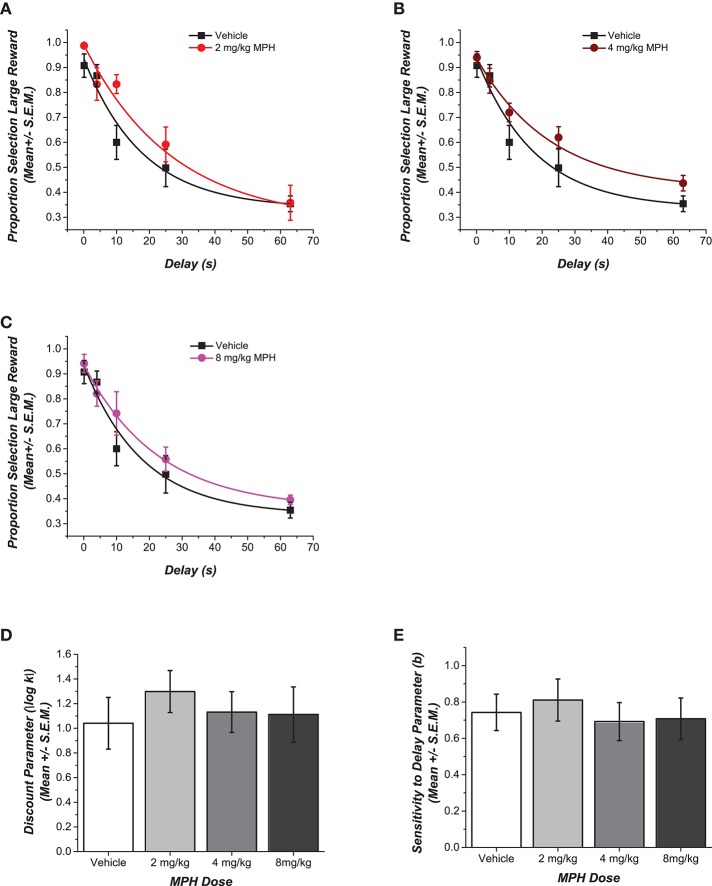
Figure 2.
Effect of adult pre-treatment with MPH on delay discounting. (A–C) Data for each MPH-pretreated group is plotted against the vehicle to depict the dose dependent differences in choice for the delayed larger reward. Data points show the mean (± SEM) proportional choice of the large reward. The curve shows the fit of Rachlin's power function to those points. (D,E) Magnitudes of the shifts in the two free parameters of the function are contrasted in the bar graphs. No statistically significant main effect of dose was observed for the different groups in their discounting rate k or in the discounting exponent b (p > 0.05).

