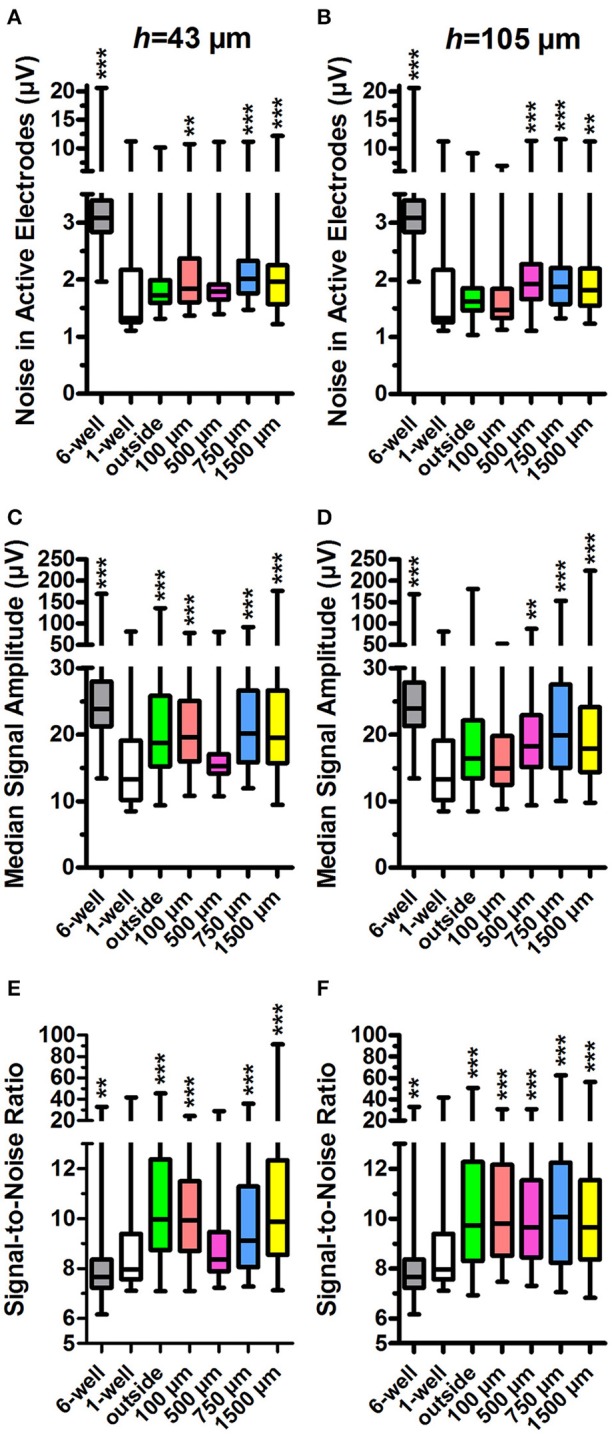
Figure 4.

Noise in active electrodes, signal amplitude and signal-to-noise ratio. The noise was calculated for active electrodes in h = 43 μm (A) and h = 105 μm tunnel devices (B) and controls (6 and 1-well MEAs). The tunnel width or control group is indicated on the x-axes. The median signal amplitude in active electrodes in h = 43 μm (C) and h = 105 μm devices (D) and controls was also calculated. The signal-to-noise-ratio (SNR) in h = 43 μm (E) and h = 105 μm devices (F) was calculated from the noise and median signal amplitude in active electrodes. n (active electrodes) is 61–547 (weekly numbers of active electrodes are in Table 1). Please note that the low number of h = 43 μm, w = 500 μm tunnels (2) may affect the results. Statistical differences between groups were analysed using the Kruskal-Wallis test, and the * symbols indicate significant differences using Dunn's post hoc test vs. the 1-well control (*0.05 > p ≥ 0.01; **0.01 > p ≥ 0.001; ***p > 0.001).
