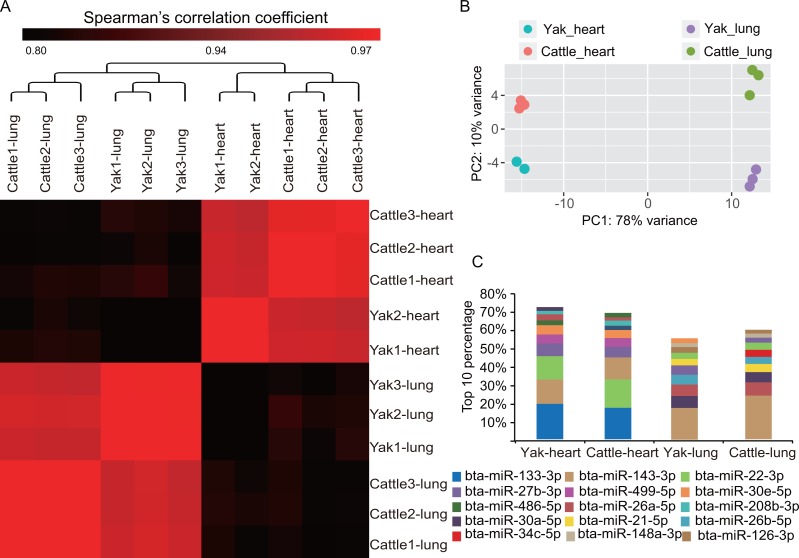
Figure 2. Highly conserved heart and lung tissues showed varying degrees of divergence.
(A) Hierarchical clustering and heat map matrix of pairwise Spearman’s correlations of the counts of 718 co-expressed miRNAs between 11 miRNA libraries. (B) Principal component analysis (PCA) plot of each sample. The fraction of the variance explained is 78% for eigenvector 1 and 10% for eigenvector 2. (C) Top 10 unique miRNAs with the highest expression levels in heart and lung tissues of yak and cattle.

