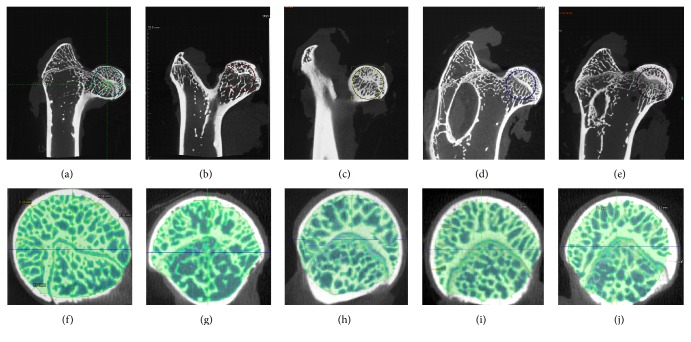
Figure 2.
Micro-CT scanning images. A representative micro-CT image from the model group (b, g) showed that the trabecular bone was sparser in the subchondral bone compared with the control group (a, f). In the prevention groups (enoxaparin group (c, h), ginkgo group (d, i), and combination group (e, j)), the trabecular bone was thicker and denser. The circles in the images represented the chosen area to analyze the micro-CT parameters.

