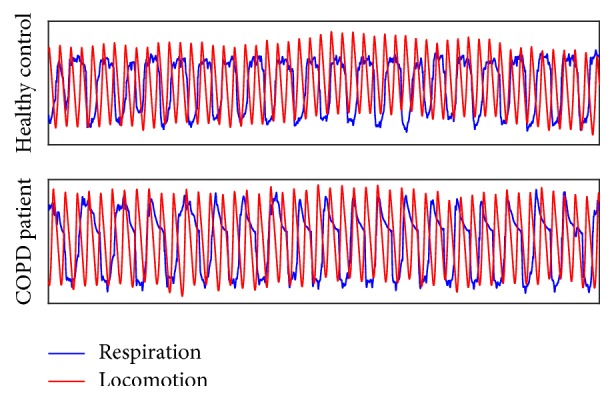
Figure 4.

Representative data from breathing and walking from a patient with COPD and a healthy control. The red line represents the heel marker and the blue line represents flow data from breathing. Data shown are from the first minute of walking. Both time series have been normalized to a mean of zero and standard deviation of one.
