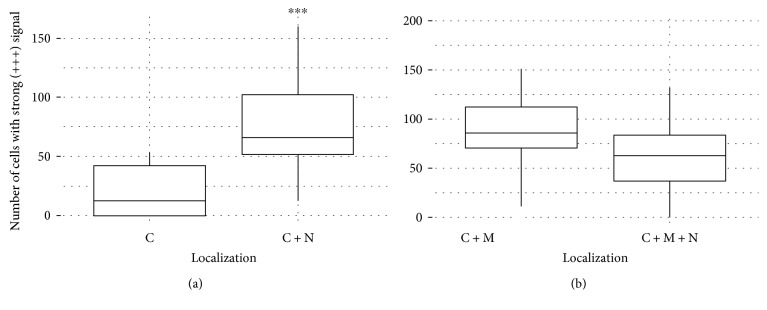
Figure 3.
(a) Diagram of distribution of cells with strong DVL3 signal regarding localization (C and C+N). The graphs showing Wilcox rank of W = 241 and P value P = 6.33 × 10⁻⁵. ∗∗∗ denotes statistical significance. (b) Diagram of distribution of cells with strong sFRP3 signal regarding localization (C+M and C+M+N). The graphs showing Wilcox rank of W = 144 and P value P = 0.1903.

