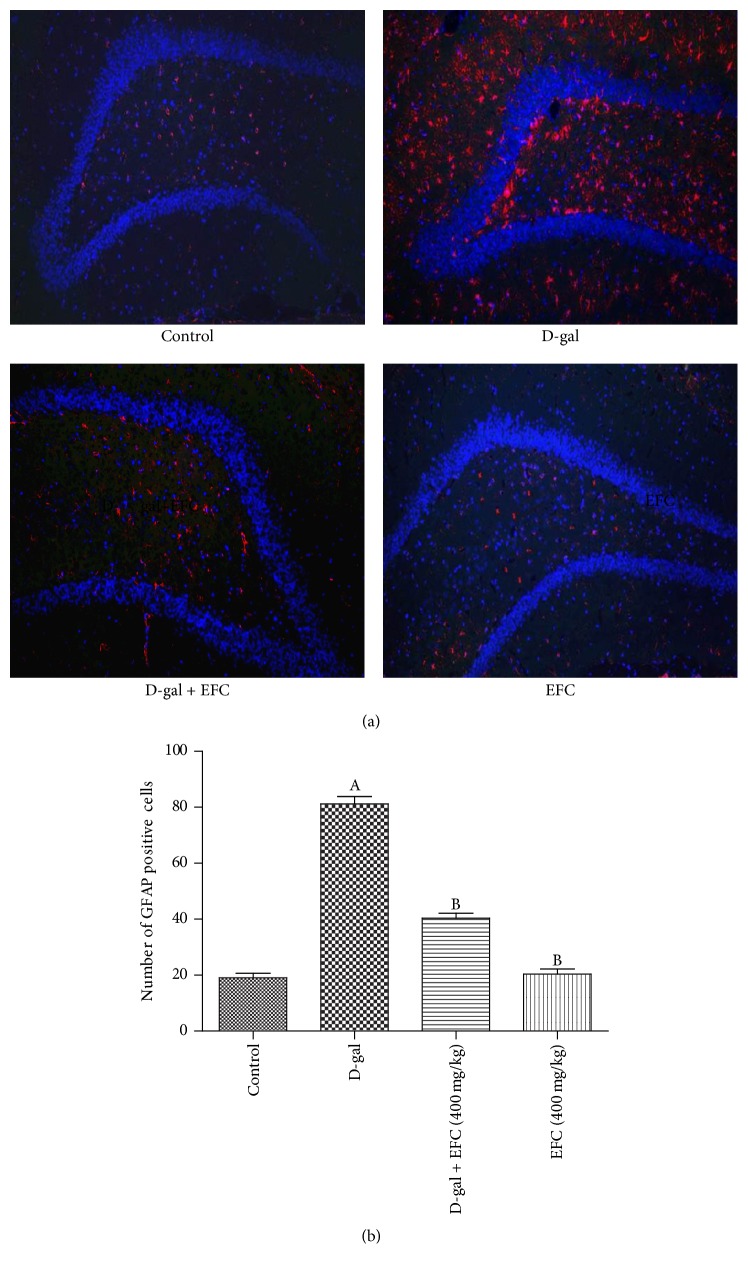
Figure 7.
Effect of EFC on GFAP expression in the dentate gyrus of hippocampus in D-gal-treated rats measured by immunofluorescence (×100). (a) The images of immunofluorescence staining of GFAP (red), the scale bar represents 100 μm. (b) The bar graph summarizing the number of GFAP-positive cells. All values are expressed as mean ± SE (n = 4), AP < 0.05 as compared to the normal control group. BP < 0.05 as compared to the D-gal model group.

