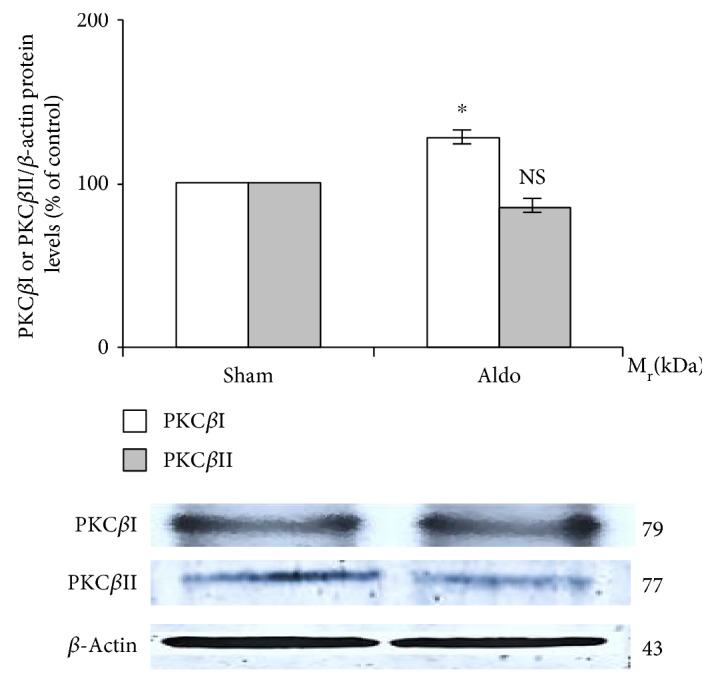
Figure 1.

Western blot analysis of renal PKCβI and PKCβII protein abundance in the sham and Aldo groups. Histogram bars show the densitometric analyses ratios of PKCβI, or PKCβII to β-actin intensity, and the representative immunoblot photographs are present. Data are means ± SD of 8 independent experiments. ∗P < 0.05 compared with the sham group.
