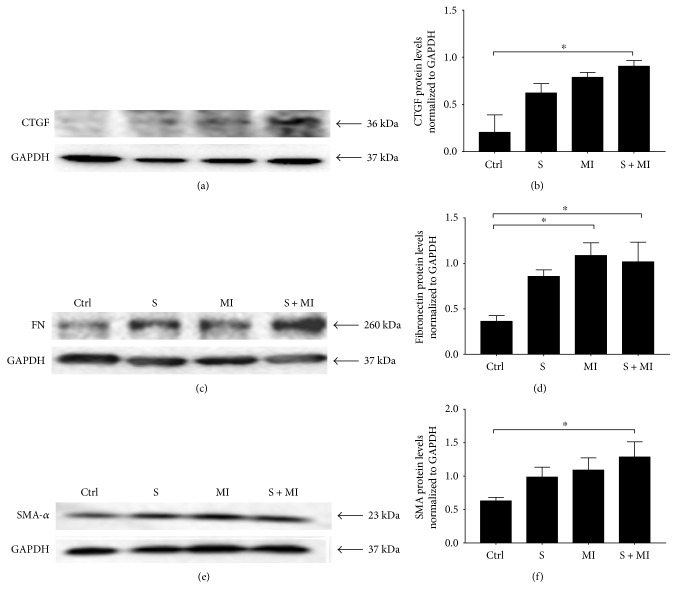
Figure 6.
Effect of S and MI on CTGF, FN, and SMA protein expression. Western blot analysis showing the effect of S and MI on the protein expression of (a) CTGF, (c) FN, and (e) SMA markers in the kidney. (b, d, f) Histogram analysis showing the relative levels of expression of the above proteins relative to GAPDH. S+MI group, but not S alone, showed a significant increase in the expression of CTGF, FN, and SMA, in comparison to controls. Quantification was done by measuring the intensity of each band by densitometry, using ImageJ software. Values represent the average fold change, normalized to GAPDH, and relative to control. Results are representatives of five independent experiments (n = 5), for each condition, reported as the mean ± SEM. ∗ indicate p < 0.05.

