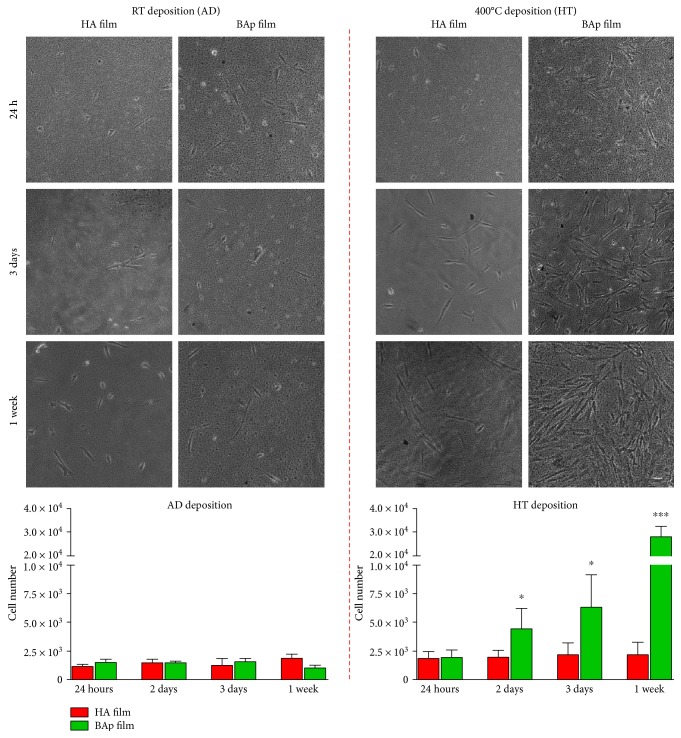
Figure 2.
Representative phase contrast images showing hDPSC adhesion after 24 h of culture and cell proliferation on HA and BAp films after room temperature deposition (AD) and after 400°C deposition (HT) up to one week. Histograms represent the growth kinetics of hDPSCs cultured on different films at different time points. ∗P < 0.05, ∗∗∗P < 0.001 hDPSCs cultured on BAp_HT versus hDPSCs cultured on HA_HT films. Scale bar: 10 μm.

