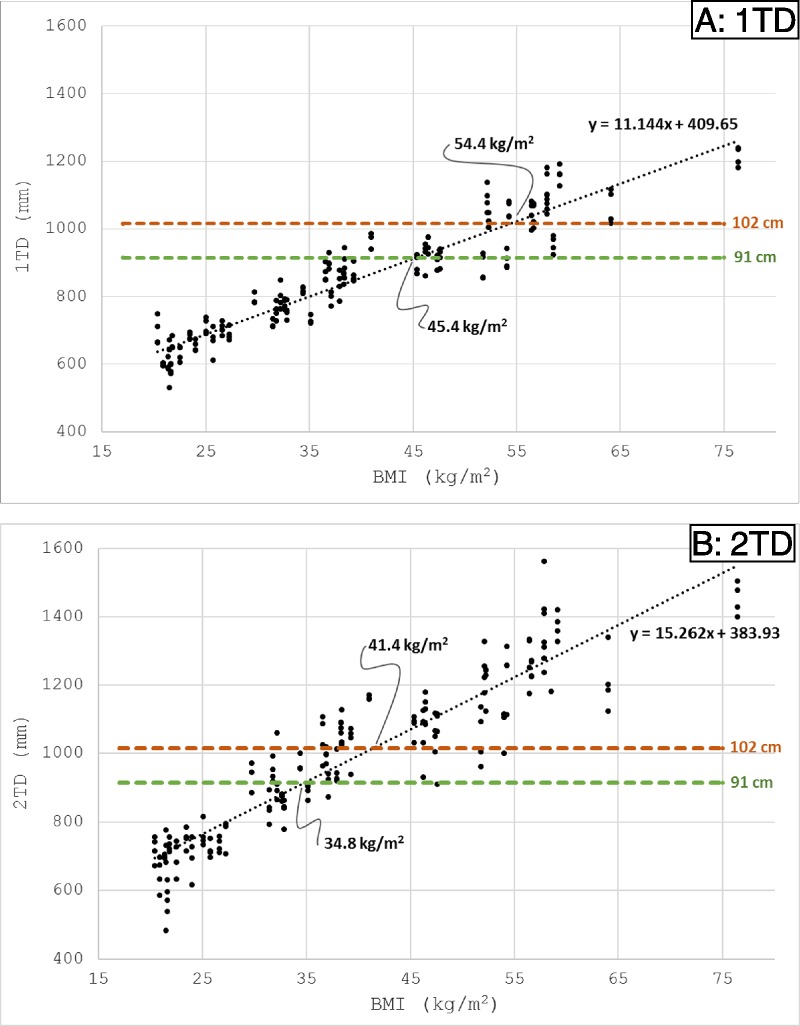
FIGURE 2.

(A) Scatter plot of body mass index (BMI) versus space occupied when turning one direction (1TD) for all experimental trials. The horizontal lines represent common hospital bed widths. The BMI values for the intersection of the line fit and hospital bed widths are labeled. (B) Scatter plot of BMI versus space occupied when turning both directions (2TD) for all experimental trials. The horizontal lines represent common hospital bed widths. The BMI values for the intersection of the line fit and hospital bed widths are labeled.
