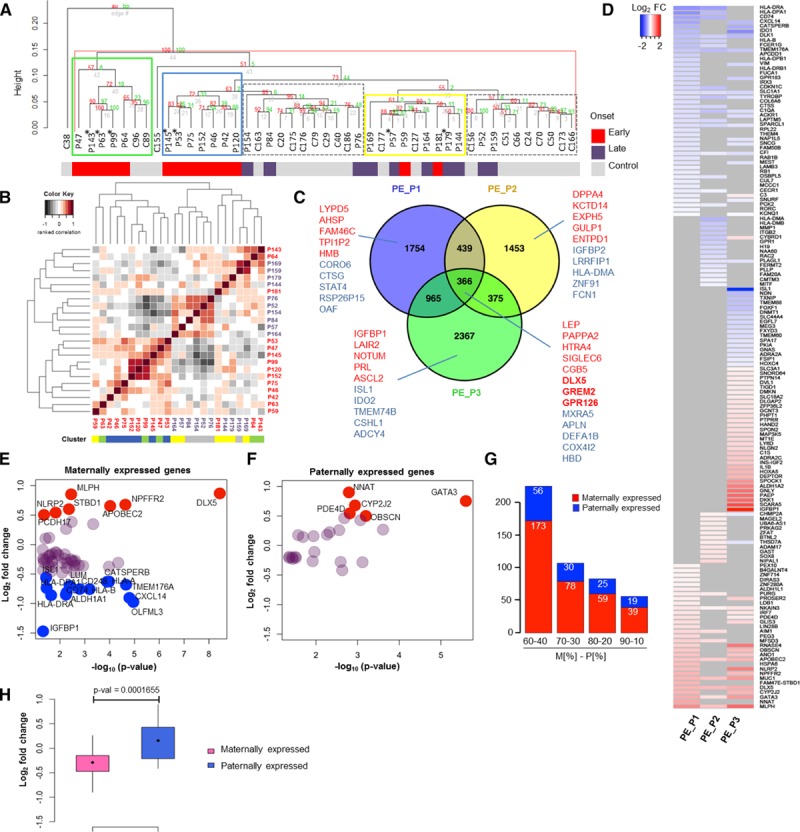
Figure 1.

Gene expression analysis of preeclamptic and healthy placenta samples. A, Hierarchical clustering analysis of microarray data identified 3 preeclamptic groups in placenta, PE_P1 (blue), PE_P2 (yellow), and PE_P3 (green), and 2 control groups, C1 and C2 (gray, dashed) (control placenta, n=22; preeclamptic placenta, n=24). The onset of preeclampsia (by gestational age at delivery) for each sample is indicated. *Preeclampsia+intrauterine growth restriction samples. B, Clustering analysis of clinical data. Heat map representing pairwise correlation between patients based on the clinical data (Table I in the online-only Data Supplement). Hierarchical cluster dendrogram was calculated with ranked correlation and complete linkage method on relative values from the clinical variables (n=36). Height of dendrograms represents the euclidian distance. C, Venn diagram of differentially expressed genes (DEGs) in 3 preeclamptic clusters (DEG on P<0.05). Top upregulated (red) and downregulated (blue) genes for each cluster are shown. D, Imprinted genes in preeclampsia. Heat map representing differential expression of imprinted genes in the 3 preeclamptic clusters vs. controls (DEG P<0.05). Log2-fold change of differential expression of maternally (E) and paternally (F) expressed genes (MEGs and PEGs) in all preeclampsia cases (DEG P<0.05). Genes with log2-fold change ≥0.5 are shown in red and with ≤−0.5 change in blue. G, Distribution of differentially expressed MEGs and PEGs in preeclampsia according to different criteria for maternal to paternal allelic expression ratio (MEGs, M[%]-PEGs, P[%]): 60-40, 70-30, and 90-10. H, Wilcoxon test on the mean log2-fold change expression of differentially expressed MEGs and PEGs in preeclampsia.
