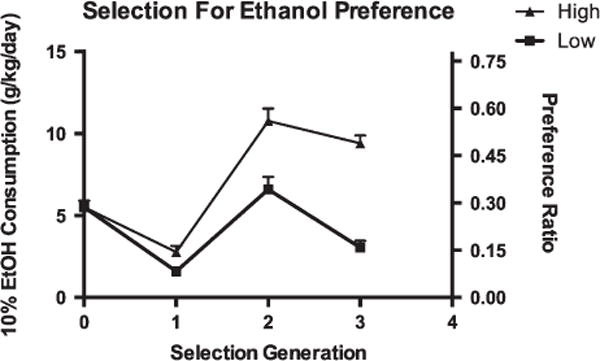
Figure 1. Differences in ethanol preference and consumption as a result of bidirectional selection.

Left y-axis: consumption of 10% ethanol averaged from experimental days 10 and 12 expressed as g/kg ethanol consumed per day. Right y-axis: ethanol preference ratio (ratio of milliliters of 10% ethanol consumed to total milliliters of fluid consumed).
