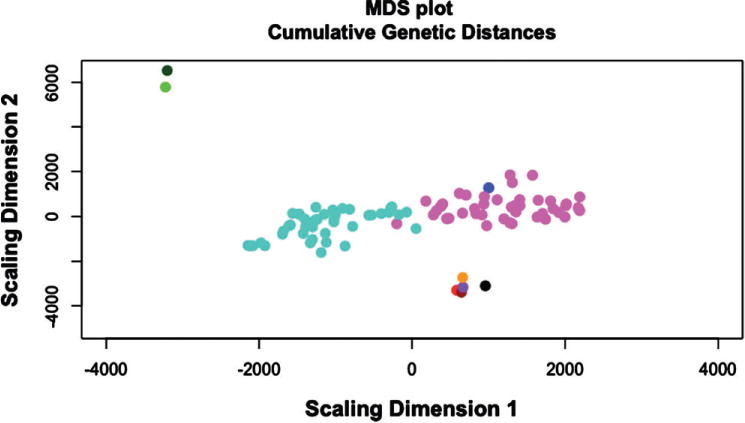
Figure 2. Multidimensional scaling (MDS) plots of genome-wide differences between high (magenta) and low (turquoise) ethanol-preferring selected lines compared with the founding strains (B6 = red, AJ = brown, 129 = purple, NOD = black, NZO = orange, CAST = dark green, PWK = green, WSB = blue) of the HS-CC founder stock.

This figure illustrates strong genetic divergence between high and low preferring lines, in part because of the incorporation of wild-derived alleles in the low line. Additionally, it is notable the WSB/EiJ strain appears most genetically similar to the high preferring line.
