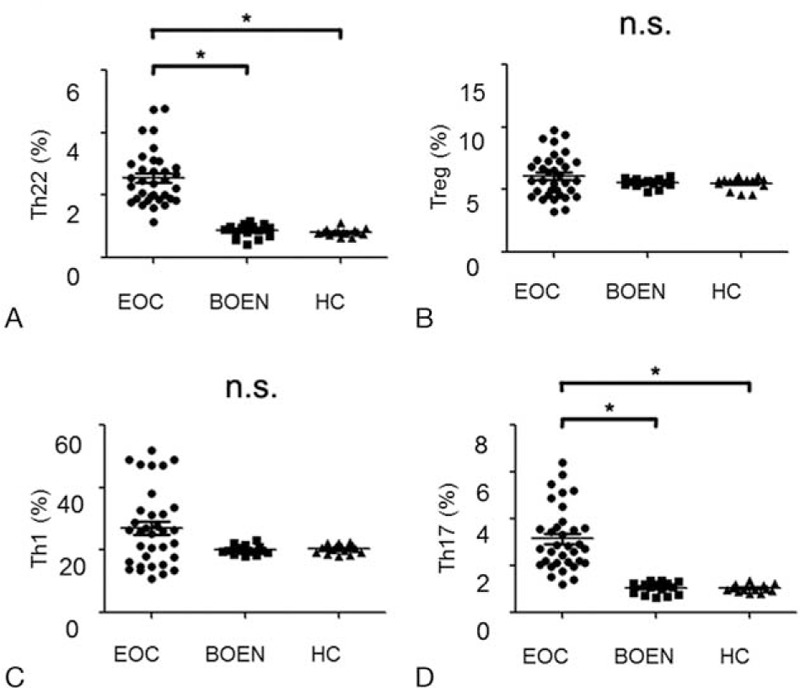
Figure 1.

The percentages of circulating Th1 cells, Th17 cells, Th22 cells and Treg cells in EOC, BOEN patients and healthy controls. Flow cytometry was performed and quantitative results were shown. One way ANOVA and Newman-Kuels multiple comparison tests were used for assessing the normal distribution data. Kruskal-Wallis and Nemenyi tests were used for unusual data. A, Th22 (CD4 + IFNγ – IL17 – IL-22 +) cells. B, Treg (CD4 + CD25 + Foxp3 +) cells. C, Th1 (CD4 + IFNγ +) cells. D, Th17 (CD4 + IL17 + IFNγ − ) cells. ∗P < .05; n.s. = no significant difference.
