
Figure 2.
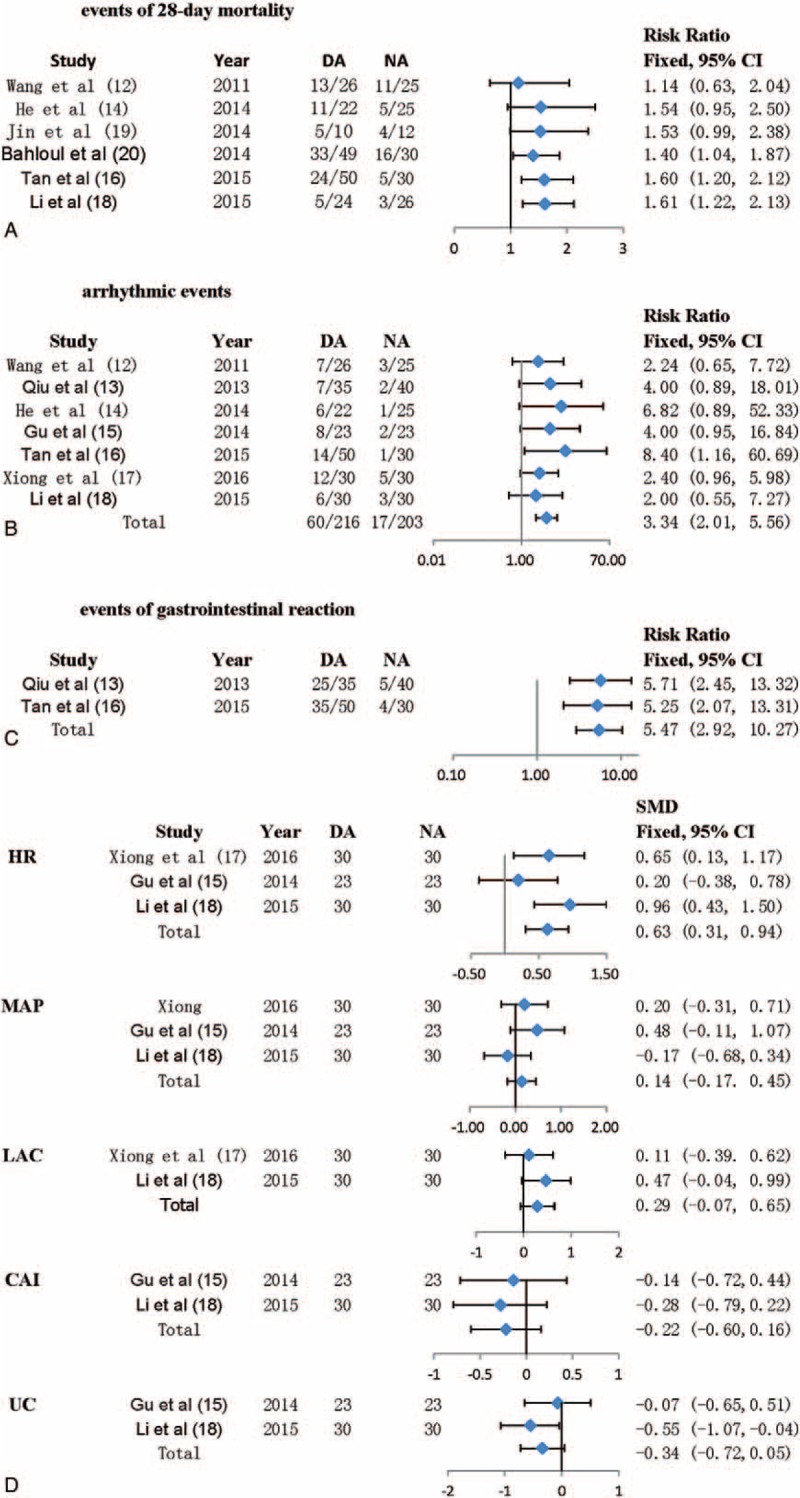
Risk estimates of primary and secondary outcomes for NA versus DA. Forest plots show results for 28-day mortality (A), incidence of arrhythmic events (B), gastrointestinal reaction (C), and some indexes after treatment (D). A fixed-effect model was applied to estimate RR and 95% CI.