
Figure 4.
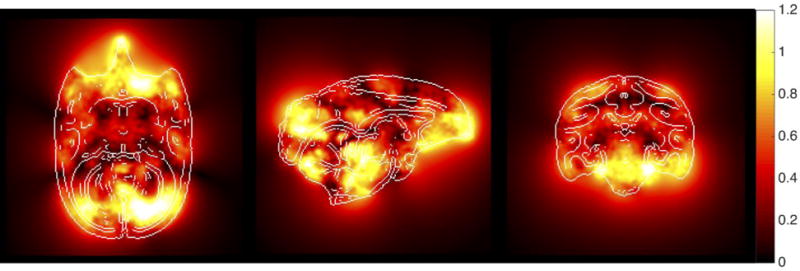
Mean displacement map. The deformation fields that nonlinearly align each subject to the atlas template were averaged to create the mean displacement map. This map displays the average distance (in mm) that each voxel from all brains was displaced in order to align with the corresponding location in the atlas, and represents inter-subject anatomical variability. The locations are the same slices as shown in Figure 1, with edges highlighted to facilitate visualization.