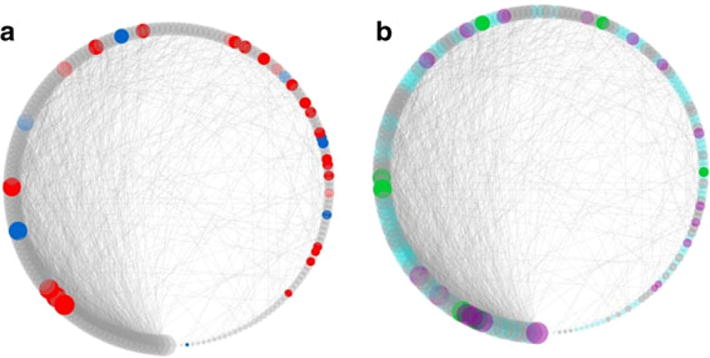
Figure 2.

Consumption-correlated genes cluster in a module (light cyan) significantly enriched in synapse and membrane annotations. (a) Positively (red) and negatively (blue) correlated genes. (b) Genes annotated with synapse part are colored in cyan, genes annotated with membrane part are colored in green, and genes with both annotations are colored in purple. Node size is proportional to module connectivity. For visual clarity, only edges with adjacency values over 0.1 are depicted
