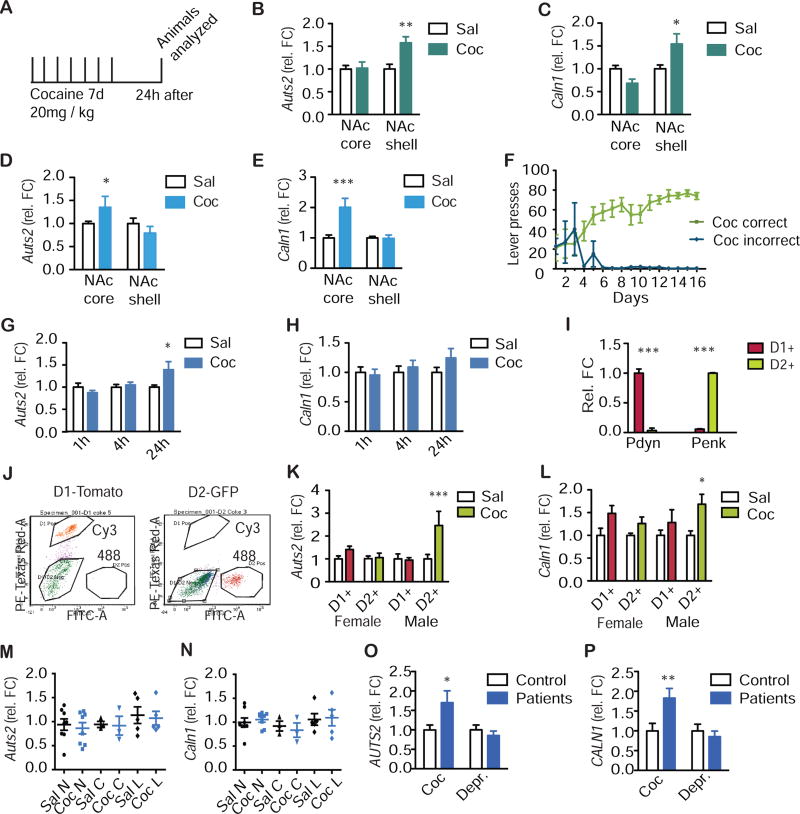
Figure 2.
Expression of Auts2 and Caln1 is increased by repeated cocaine administration. a, Cocaine paradigm: Mice or rats were I.P.-injected for 7 days with saline (sal) or 20 mg/kg cocaine (coc) and analyzed 24 h later. b,c, Separate punches were taken from rat NAc shell and core. b, qPCR was conducted for Auts2. N=8,8,8,8. Two-way ANOVA: interaction: F(1,28)=5.83, P<0.05; drug factor: F(1,28)=6.71, P<0.05; brain region: F(1,28)=5.83, P<0.05. Bonferroni: sal vs. coc: NAcc: P>0.05; NAcs: **P<0.01. c, qPCR was conducted for Caln1. N=12,12,12,12. Two-way ANOVA: interaction: F(1,44)=10.68, P<0.01; drug factor: F(1,44)=0.16, P>0.05; brain region: F(1,44)=2.22, P<0.01. Bonferroni: sal vs. coc: NAcc: P>0.05; NAcs: *P<0.05. d, e, Rats self-administered cocaine for 10 days and were analyzed 24 h after the last session. Separate punches were taken from NAc shell and core. d, qPCR was conducted for Auts2. N=9,8,9,8. Two-way ANOVA: interaction: F(1,30)=9.76, P<0.01; drug factor: F(1,30)=2.22, P>0.05; brain region: F(1,30)=9.76, P<0.01. Bonferroni: sal vs. coc: P<0.05*; P>0.05. e, qPCR was conducted for Caln1. N=9,9,9,9. Two-way ANOVA: interaction: F(132)=9.57, P<0.01; drug factor: F(1,32)=9.06, P<0.01; brain region: F(1,32)=9.57, P<0.01**. Bonferroni: sal vs. coc: NAcc: ***P<0.001; NAcs: P>0.05. f, Acquisition curve for cocaine self-administration. Correct and incorrect lever presses for the cocaine group are shown. N=8 per group. Two-way ANOVA: interaction: F(121,182)=5.51, P<0.0001; drug factor: F(1,182)=328.9, P<0.0001; time factor: F(12,182)=4.36, P<0.0001. Bonferroni: sal vs. coc: Days −3: P>0.05; all other days: P<0.001. g,h, Punches were taken of whole NAc of male mice. g, qPCR was conducted for Auts2. N=10,11 ;11,11;11,11. Two-way ANOVA: interaction: F(2,59)=3.80, P<0.05; drug factor: F(1,59)=1.84, P>0.05; time factor: F(2,59)=3.80, P<0.05. Bonferroni: sal vs. coc: P>0.05; P>0.05; *P<0.05. h, qPCR was conducted for Caln1. N=10,11,11,11,11,11. 2 way ANOVA with Bonferroni: interaction: F(2,59)=0.87, P>0.05; drug factor: F(1,59)= 1.15, P>0.05; time factor: F(2,59)=0.84, P>0.05. Bonferroni: sal vs. coc: all P>0.05. i-l, FACS sorting on NAc punches of D1-GFP and D2-Tomato mice. i, Specificity of D1/D2-MSN markers was assessed by qPCR for Pdyn and Penk. N=36,36;30,30. Two-way ANOVA: interaction: F(1,128)=485.1, P<0.0001; gene factor: F(1,128)=0.07, P>0.05; cell factor: F(1,128)=0.07, P>0.05. Bonferroni: D1 vs. D2: ***P<0.001; ***P<0.001. j, FACS on Cy3 and Alexa488 lasers. k, qPCR was conducted for Auts2. N=10,10:7,7;8,6;9,7. Two-way ANOVA: interaction: F(3,56)=3.84, P<0.05; drug factor: F(3,56)=6.97, P<0.05; factor of sex and cell type: F(3,56)=3.79, P<0.05. Bonferroni: sal vs. coc: P>0.05; P>0.05; P>0.05; ***P<0.001. l, qPCR was conducted for Caln1. N=10,10;7,7;9,7;9,7. Two-way ANOVA: interaction: F(3,84)=0.72, P>0.05; drug factor: F(1,84)=13.38, P<0.001; factor of sex and cell type: F(3,84)=0.72, P>0.05. Bonferroni: sal vs. coc: P>0.05; P>0.05; P>0.05; *P<0.05. m, n, Punches were taken of whole NAc of female mice at nuclear (N), corneal (C), and lucidic (L) stages of their estrous cycle. m, qPCR was conducted for Auts2. N=8,8;3,3;5,5. Two-way ANOVA: interaction: F(2,26)=0.01, P>0.05; drug factor: F(1,26)=1.01, P>0.05; estrous factor: F(2,26)=0.19, P>0.05. Bonferroni: sal vs. coc: all P>0.05. n, qPCR was conducted for Caln1. N=8,8;3,3;5,5. Two-way ANOVA: interaction: F(2,26)=0.20, P>0.05; drug factor: F(1,26)=1.47, P>0.05; estrous factor: F(2,26)=0.01, P>0.05. Bonferroni: sal vs. coke: all P>0.05. o, p, RNA was extracted from NAc postmortem samples from human cocaine addicts or patients that suffered from depression and their matched controls (ctrl). o, qPCR was conducted for Auts2. N=15,14,14,14. Two-way ANOVA: interaction: F(1,53)=5.36, P<0.05; factor of disease: F(1,53)=2.74, P>0.05; factor of patients: F(1,53)=5.36, *P<0.05. Bonferroni: ctrl vs. patients: *P<0.05; P>0.05. p, qPCR was conducted for Caln1. N=14,13,14,14. Two-way ANOVA: interaction: F(1,51)=5.36, P<0.05; factor of disease: F(1,51)=5.47, P<0.05; factor of patients: F(1,51)=5.36, P<0.05,. Bonferroni: ctrl vs. patients: **P<0.01 ; P>0.05. b-i, k, l, o, p, Average +/− SD shown.

