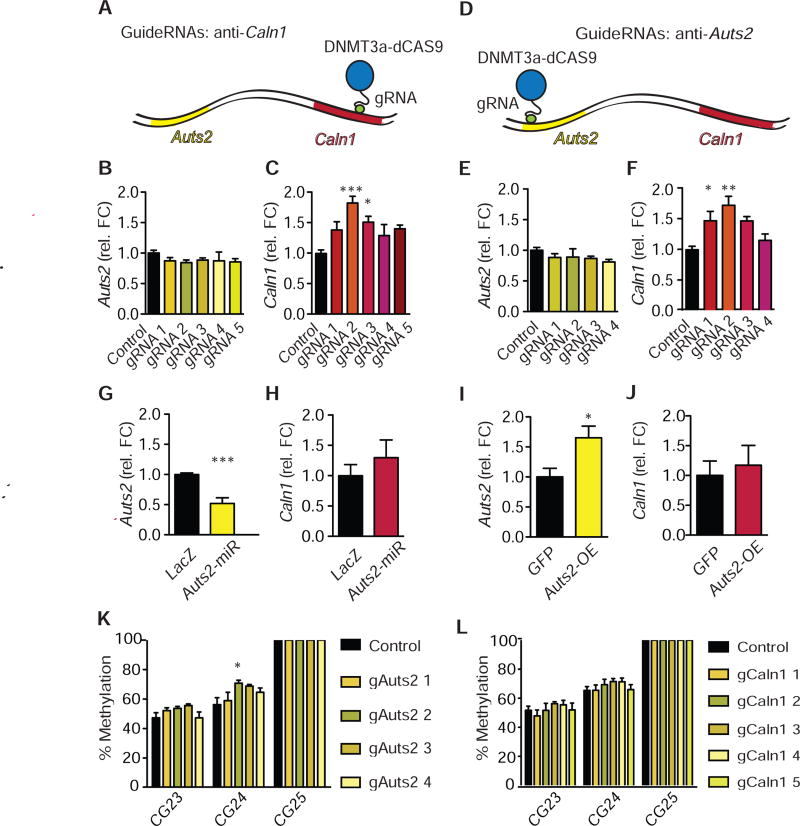
Figure 4.
Increased DNA methylation on Auts2 and Caln1 genes increase Caln1 expression. a, Overview over CRISPR-binding on Caln1. b,c, Neuro2A cells were co-transfected with dCas9-DNMT3ACD-DNMT3LCD-3xFLAG CRISPR and either sham (“p1005”) or Caln1 guide RNA. b, qPCR was conducted for Auts2. N=6 per group. One-way ANOVA: F(5,35)=0.59, P>0.05; Tukey’s test vs. p1005-ctrl: all P>0.05. c, qPCR was conducted for Caln1. N=6 per group. One-way ANOVA: F(5,35)=5.50, P=0.001; Tukey’s test vs. p1005-ctrl: P>0.05; ***P<0.001; *P<0.05; P>0.05; P>0.05. d, Overview over CRISPR-binding on Auts2 e, f, Neuro2A cells were co-transfected with dCas9-DNMT3ACD-DNMT3LCD-3xFLAG CRISPR and either sham (“p1005”) or Auts2 guide RNA. e, qPCR was conducted for Auts2. N=6 per group. One-way ANOVA: F(4,29)=0.86, P>0.05; Tukey’s test vs. p1005-control: all P>0.05. f, qPCR was conducted for Caln1. N=6 per group. One-way ANOVA: F(4,29)=6.41, P=0.001; Tukey’s test vs. p1005-control: *P<0.05; **P<0.01; P>0.05; P>0.05. g, h, Neuro2A cells were transfected with either Auts2-miR or LacZ control. g, qPCR was conducted for Auts2. N=9,6. Student’s t-test: t13=5.82, P<0.0001***. h, qPCR was conducted for Caln1. N=9,6. Student’s t-test: t13=0.90, P>0.05. i, j, NAc punches were obtained from D2-Cre mice that had been injected 3 days prior with an Auts2-p1005-LSIL-HSV or p1005- LSIL-HSV, which express Auts2 or GFP, respectively, in a Cre-dependent manner. i, qPCR was conducted for Auts2. N=5.3. Student’s t-test: t6=2.736, *P<0.05. j, qPCR was conducted for Caln1. N=5,3. Student’s t-test: t6=0.4314, P>0.05. k, l, DNA methylation on a putative CTCF-site of Auts2 is increased by dCas9-DNMT3A/3L combined with Auts2 guide-RNAs (k) but not by guide-RNAs against Caln1 (l). Statistics for k and l are given in Fig. S8 and S9. b, c, e-l, Average +/− SD are shown.

