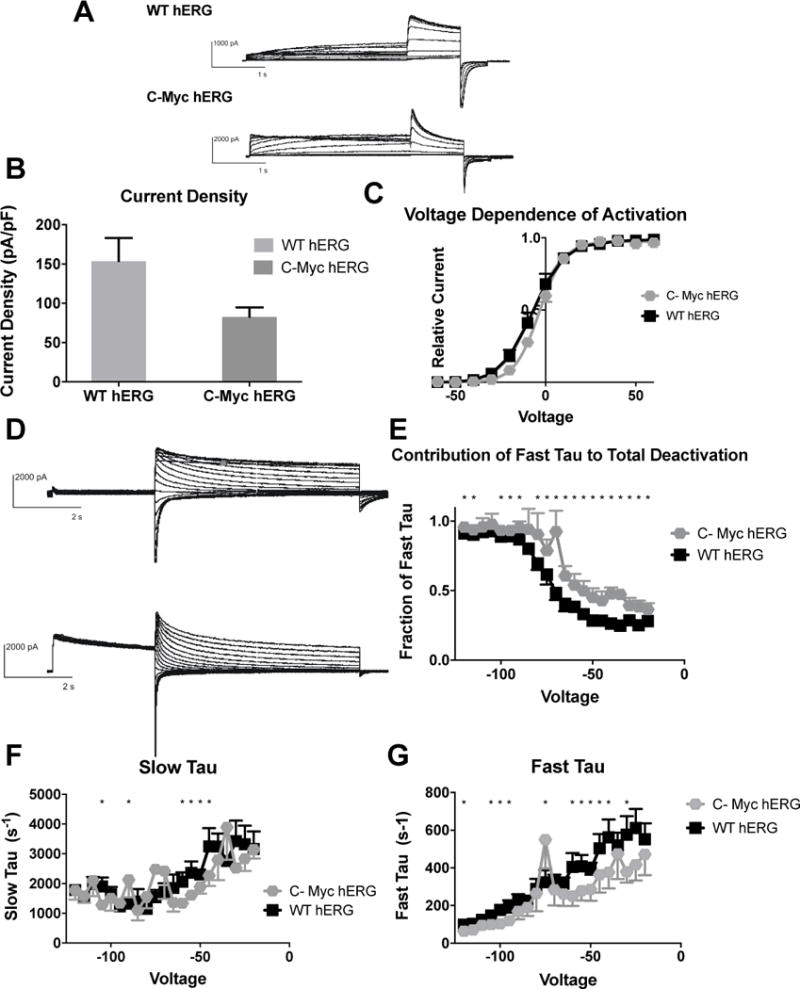
Figure 5. Effects of C-Terminal myc Fusion on hERG channel activation and deactivation.

A) Whole cell patch clamp traces of WT hERG and C-terminal-myc hERG activation. Voltage clamp protocol shown below trace. B) Current density for WT hERG and C-terminal-myc hERG shown in graph form, normalized to cell capacitance. There are no significant differences in current density (n= 6 (WT) and 9 (C-terminal-myc c hERG)), although there is a trend towards decreased current density in the C-terminal-myc hERG (p=0.0943). C) Voltage Dependent Activation (VDA) shown for WT hERG and C-terminal-myc hERG. The C-terminal-myc fusion tag is associated with a small depolarizing shift in the VDA. V1/2 for WT hERG is −7.182 ± .3884 and V1/2 for C-terminal-myc hERG is −3.421 ± .1778 D) Whole cell patch clamp traces of WT hERG and C-terminal-myc hERG activation. N= 12 (WT hERG) and 7 (C-Myc hERG). E) Contribution of Fast Tau to total time constant of deactivation. C-terminal-myc hERG has significantly more contribution of Fast deactivation to total time of deactivation at every voltage (p<0.05) except −85, −105 and −110, and here there is a trend towards faster deactivation (p<0.1) F) Graph demonstrates WT and C-terminal-myc hERG Slow Tau deactivation. There are significant differences between the two hERG channels at −45–−60 mV, −75, −90 and −105 mV (p<0.05). G) Graphical representation of Fast Tau deactivation. There are differences between WT hERG and C-terminal-myc hERG at −30 mV, −40 – −60 mV, −75, −95–−105, −120 mV. The C-terminal-myc variants do affect hERG channel deactivation kinetics, primarily in the amount Fast Tau contributes to the overall deactivation rate of the channel.
