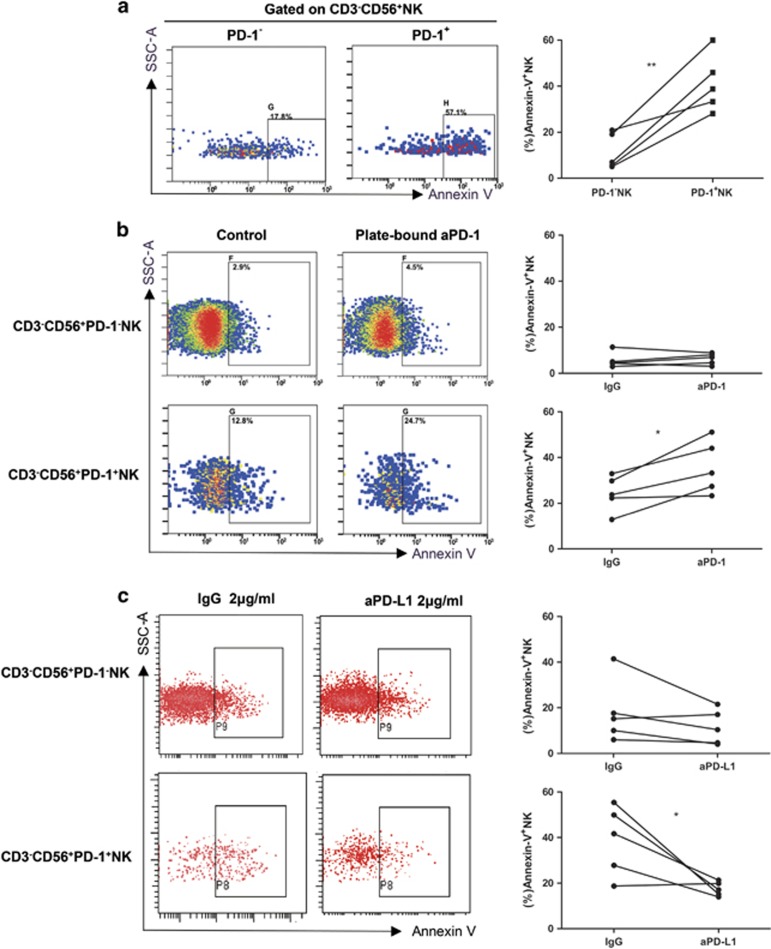
Figure 4.
PD-1/PD-L1 signaling induces apoptosis of PD-1+ NK. (a) Representative dot plots (left panel) depicting the spontaneous apoptosis (annexin-V staining) of PD-1+ and PD-1− NK cells from one ESCC patient and pooled data (right panel). (b) NK cells from ESCC patients were cultured without or with plate-bound anti-PD-1 (aPD-1) (8 μg/ml), and apoptosis (annexin-V staining) of PD-1− and PD-1+ NK cells was compared between the two groups. PMA and ionomycin were applied for 3 h to stimulate activation-induced apoptosis. (c) After pre-incubation with 8 μg/ml IgG or PD-L1 blocking antibodies (aPD-L1), NK cells isolated from ESCC patients were stimulated with PMA and ionomycin and apoptosis of PD-1− and PD-1+ NK cells were compared. Cumulative data are shown as mean±s.e.m., analyzed by Student’s t-test. The data were normally distributed and had constant variances. *P⩽0.05, **P⩽0.01, ***P⩽0.001.

