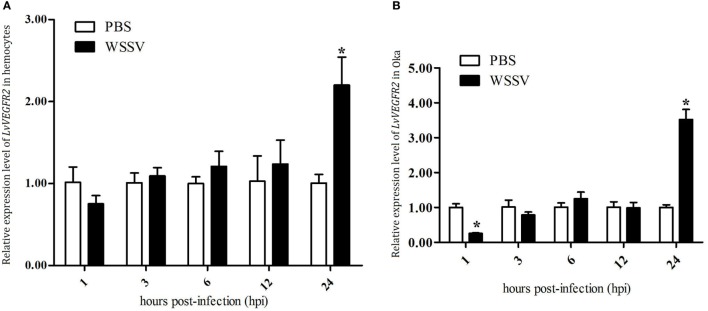
Figure 5.
Expression profile of LvVEGFR2 in hemocytes (A) and Oka (B) at different time post WSSV infection (hpi). PBS, phosphate-buffered saline injection group; WSSV, white spot syndrome virus injection group. Stars (*) indicate significant differences (P < 0.05) for the gene expression levels between PBS and WSSV groups.

