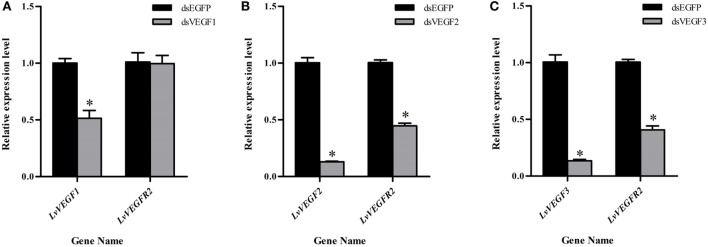
Figure 8.
Expression level of LvVEGFR2 in the cephalothorax of shrimp after injection of dsVF1 (A), dsVF2 (B), and dsVF3 (C). dsEGFP, injected with dsEGFP; dsVF1, injected with dsLvVEGF1; dsVF2, injected with dsLvVEGF2; dsVF3, injected with dsLvVEGF2. Stars (*) show significant differences (P < 0.05) for the gene expression levels between two groups.

